Sony A100 Imatest(tm) Results
Analysis by Dave EtchellsWe've been using Norman Koren's excellent "Imatest" analysis program for a little while now, for quantitative, thoroughly objective analysis of digicam test images. I highly commend it to our technically-oriented readers, as it's far and away the best, most comprehensive analysis program I've found to date.
My comments below are just brief observations of what I see in the Imatest results. A full discussion of all the data Imatest produces is really beyond the scope of this review: Visit the Imatest web site for a full discussion of what the program measures, how it performs its computations, and how to interpret its output.
Here's some of the results produced by Imatest for the Sony DSLR-A100:
Color Accuracy
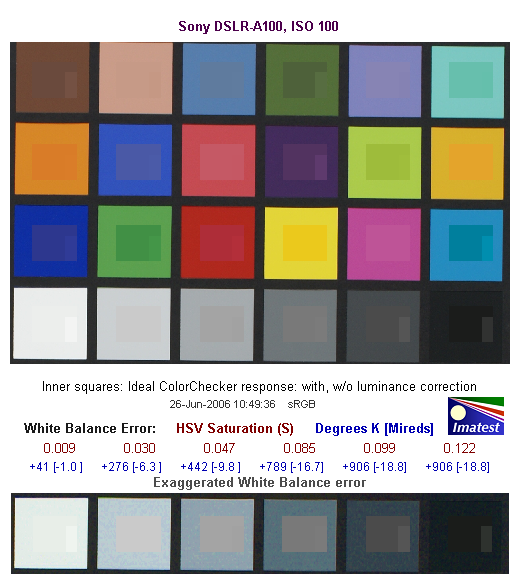
The Sony A100 showed good color accuracy overall, and held reds in check better than most cameras we test with the MacBeth target. It does get a bit carried away with strong blues, but we didn't experience this as a problem with our standard test subjects, nor in the random "gallery" shots we took with the camera. Hue accuracy is very good, just slightly off the best we've seen. The primary color shifts that users would notice would be a shift of reds towards orange, and the very typical shift of cyans towards pure blues. (This is a very common tactic among cameras we've tested, we think aimed at producing more appealing sky colors.) Oranges are also shifted towards yellows, and yellows slightly towards yellow-greens, but these shifts are relatively minor.
Average saturation was 109.2% (oversaturated by 9.2%, largely in the blues, but somewhat in the reds as well), average "delta-E" color error was 5.72.
Most consumer cameras have artificially bright color, as that's what the average consumer demands. Apart from its boost in the blues, the A100 eschews the over-bright consumer color of much of its competition. This may lead some of the consumers (at which it's aimed) to think of its color as a little anemic, but that's only in comparison to competing models that are overly bright. The good news is that it's easy to simply boost the A100's saturation via a menu option if you decide you'd like your color a bit brighter-looking. Bottom line, very accurate color for a consumer SLR, with an option to add a little punch if your personal tastes demand it.
Color Analysis
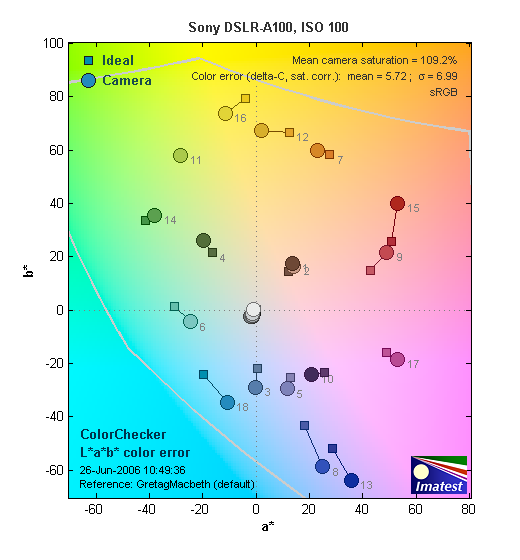
This image shows how the Sony A100 actually rendered the colors of the MacBeth chart, compared to a numerically ideal treatment. In each color swatch, the outer perimeter shows the color as actually captured by the camera, the inner square shows the color after correcting for the luminance of the photographed chart (as determined by a 2nd-order curve fit to the values of the gray swatches), and the small rectangle inside the inner square shows what the color should actually be, based on perfect rendering in the sRGB color space.
What's interesting in the results for the A100 is how close so many of the luminance-corrected colors are to the ideal values. - In fact, about the only really obvious differences are cases in which the original (non luminance-corrected) colors were in fact very close to the originals.
Gray Patch Tone and Noise Analysis
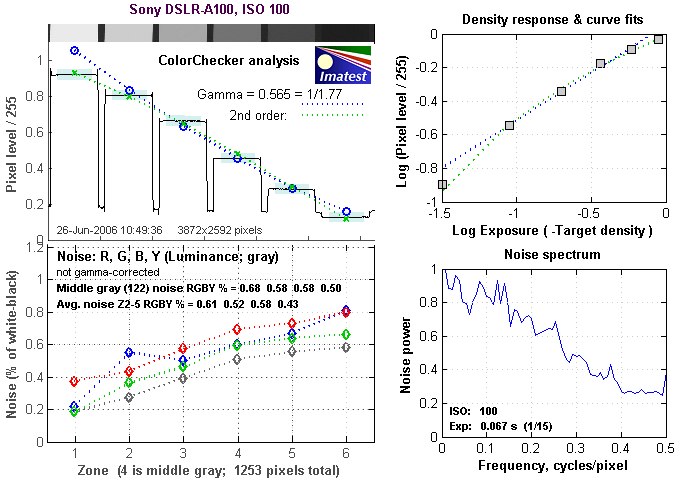
There's a lot in this particular graph, a lot more than we have room to go into here. Bottom line, the Sony Alpha A100's noise levels are low at low ISO, with a noise spectrum that spreads some of the noise energy into higher frequencies (finer grain), but that still maintains an overall weight favoring a coarser grain structure. In comparing these graphs with those from other competing cameras, I've found that the Noise Spectrum graph at lower right is the most important. Cameras that manage to shift their noise spectrum to higher frequencies have much finer-grained noise structures, making their noise less visually objectionable. In the graph above, this would show up as a noise spectrum curve that remained higher on the right side, representing higher noise frequencies.

Here's the same set of noise data at ISO 1600. Here, the Noise Spectrum graph is shifted a bit more toward the left-hand, lower-frequency side than it was at ISO 100, further coarsening the "grain" of the image noise patterns. Once again, not bad, but not a standout among competing dSLR models.
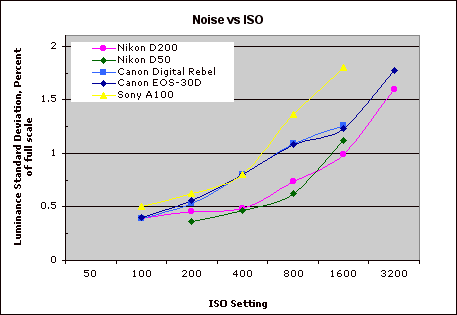
This chart compares the Sony A100's noise performance over a range of ISOs against those of other cameras. While I continue to show noise plots of this sort because readers ask for them, I each time point out that the noise magnitude is only a small part of the story, the grain pattern being much more important. In the case of the Sony A100, the magnitude of its image noise stays pretty competitive with other cameras on the market, but climbs noticeably at ISO 800 and above. Combined with the somewhat coarse noise structure mentioned earlier, the A100's noise structure at high ISO settings will be more distracting than that of most of its competitors. A good enough performer, but not a camera that you'd buy primarily for its high-ISO prowess.
Dynamic Range Analysis
A key parameter in a digital camera is its Dynamic Range, the range of brightness that can be faithfully recorded. At the upper end of the tonal scale, dynamic range is dictated by the point at which the RGB data "saturates" at values of 255, 255, 255. At the lower end of the tonal scale, dynamic range is determined by the point at which there ceases to be any useful difference between adjacent tonal steps. Note the use of the qualifier "useful" in there: While it's tempting to evaluate dynamic range as the maximum number of tonal steps that can be discerned at all, that measure of dynamic range has very little relevance to real-world photography. What we care about as photographers is how much detail we can pull out of the shadows before image noise becomes too objectionable. This, of course, is a very subjective matter, and will vary with the application and even the subject matter in question. (Noise will be much more visible in subjects with large areas of flat tints and subtle shading than it would in subjects with strong, highly contrasting surface texture.)
What makes most sense then, is to specify useful dynamic range in terms of the point at which image noise reaches some agreed-upon threshold. To this end, Imatest computes a number of different dynamic range measurements, based on a variety of image noise thresholds. The noise thresholds are specified in terms of f-stops of equivalent luminance variation in the final image file, and dynamic range is computed for noise thresholds of 1.0 (low image quality), 0.5 (medium image quality), 0.25 (medium-high image quality) and 0.1 (high image quality). For most photographers and most applications, the noise thresholds of 0.5 and 0.25 f-stops are probably the most relevant to the production of acceptable-quality finished images, but many noise-sensitive shooters will insist on the 0.1 f-stop limit for their most critical work.
The image below shows the test results from Imatest for an in-camera JPEG file from the Sony A100 with a nominally-exposed density step target (Stouffer 4110), with the A100's contrast setting at its default position.
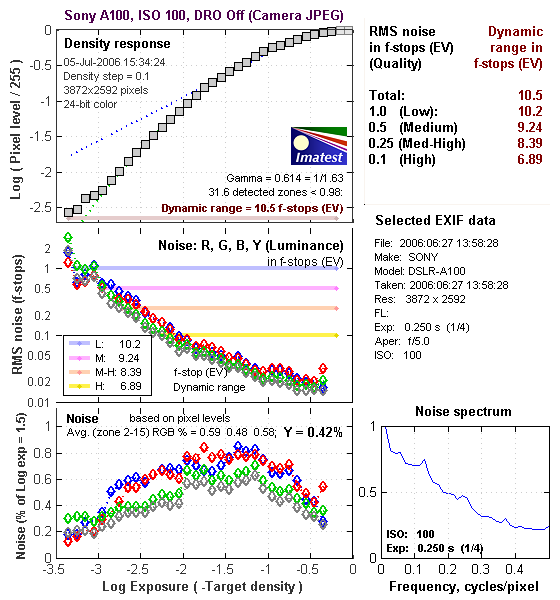
These numbers are on the low side of average for in-camera JPEGs, but the dynamic range number at "high" quality itself (6.89) isn't the most important thing to look at here. A dynamic range of 6.89 f-stops at high image quality is within a half a stop of most of the A100's competition, not enough difference to be a significant issue. (Yes, a half a stop more dynamic range would be nice, but that's not the main thing that affects what a photographer will perceive as the A100's dynamic range here.)
More significant than the absolute dynamic range is the relative abruptness with which the density curve (the curve in the top left of the figure above) ends in the highlight area, and particularly so in the shadows. The ideal shape for a tone curve is more of an "S" shape, with a longer tail in both the highlights and shadows. A long tail at both ends of the curve means that the camera approaches pure black and pure white gradually as the subject passes outside its tonal range. While this doesn't necessarily preserve more data in an absolute sense, it will provide smoother gradations in highlights and shadows, and in particular will preserve more shape in objects having highly saturated colors. I haven't written about this characteristic of camera tone curves much yet, but I'm finding that a gentle slope in the highlight range (the right side of the density curve) translates into a much more "three dimensional" appearance to its photos.
In the case of the A100, the extreme highlight end of its density curve is relatively flat, but it gets steeper a relatively short way down the tone curve. In shooting with the camera, I felt that its images tended to be somewhat contrasty, to the extent that I often found myself losing highlight detail if I boosted the exposure enough to get decent midtones under even moderately harsh lighting. This seems to be reflected in the steepness of the A100's density curve in the quarter-tones: If you set the camera's exposure so the highlights in an image are just blown out, by the time you get to the midtone levels in your subject, the output values will be pushed down pretty far into the shadow range. (In other words, midtones become 3/4 tones pretty quickly.)
These effects can be a little hard to interpret directly from the density curves: Given the contrasty "look" of the camera, I was expecting to see an even steeper highlight curve from the dynamic range test than we actually did. on the other hand though, its almost linear behavior at the shadow end of the scale does indeed correlate well with the somewhat limited detail in the deep shadows of its photos.
What about Adobe Camera Raw (ACR) though?

Using its automatic settings (which in my experience have generally worked best for dynamic range tests like this), ACR managed to fairly dramatically increase the A100's dynamic range, in terms of the number of steps that could be resolved for a given noise level (one of the larger increases in dynamic range we've seen to date with ACR), but at the cost of an even steeper tone curve in the highlight region.
You'll note that in the above, we didn't use Sony's Dynamic Range Optimization function: This is because that feature only operates in auto exposure mode with multi-segment metering enabled, and we have to shoot the dynamic range target in manual mode to insure that we get a wide enough (and entirely uniform) exposure bracket.
To get some perspective, here's a summary of the Sony DSLR-A100's dynamic range performance, and how it compares to other digital SLRs that we also have Imatest dynamic range data for. (Results are arranged in order of decreasing dynamic range at the "High" quality level.):
| Dynamic Range (in f-stops) vs Image Quality (At camera's minimum ISO) |
||||
| Model | 1.0 (Low) |
0.5 (Medium) |
0.25 (Med-High) |
0.1 (High) |
| Fujifilm S3 Pro (Adobe Camera Raw 2) |
12.1 | 11.7 | 10.7 | 9.0 |
| Sony A100 (Adobe Camera Raw 3.4) |
11.3 | 10.5 | 9.69 | 8.16 |
| Canon EOS-1Ds Mark II (Adobe Camera Raw 3) |
11.2 | 10.3 | 9.4 | 8.14 |
| Fujifilm S3 Pro | -- | 9.9 | 9.4 | 7.94 |
| Canon EOS-5D (Adobe Camera Raw 3) |
11.0 | 10.4 | 9.21 | 7.83 |
| Canon EOS-5D (Camera JPEG) |
10.2 | 9.68 | 8.82 | 7.65 |
| Nikon D200 (Adobe Camera Raw 3) |
10.6 | 9.65 | 8.96 | 7.61 |
| Nikon D50 | 10.7 | 9.93 | 8.70 | 7.36 |
| Canon EOS 20D | 10.3 | 9.66 | 8.85 | 7.29 |
| Canon Digital Rebel XT | 10.3 | 9.51 | 8.61 | 7.11 |
| Nikon D200 (Camera JPEG) |
-- | 9.07 | 8.36 | 7.11 |
| Olympus EVOLT | 10.8 | 9.26 | 8.48 | 7.07 |
| Canon EOS-1Ds Mark II (Camera JPEG) |
10.3 | 9.38 | 8.6 | 7.04 |
| Canon Digital Rebel | 10.1 | 9.11 | 8.47 | 6.97 |
| Pentax *istDs | 10.2 | 10 | 8.87 | 6.9 |
| Sony A100 (Camera JPEG) |
10.2 | 9.24 | 8.39 | 6.89 |
| Nikon D2x | -- | 8.93 | 7.75 | 6.43 |
| Nikon D70S | 9.84 | 8.69 | 7.46 | 5.85 |
| Nikon D70 | 9.81 | 8.76 | 7.58 | 5.84 |
The results shown in the table are interesting. One of the first things that struck me when I initially looked at test data for a wide range of d-SLRs, was that here again, purely analytical measurements don't necessarily correlate all that well with actual photographic experience. There's no question that the Fuji S3 Pro deserves its place atop the list, as its unique "SR" technology does indeed deliver a very obvious improvement in tonal range in the highlight portion of the tonal scale. I was surprised to see the analytical results place the Olympus EVOLT as highly as they did, given that our sense of that camera's images was that they were in fact noisier than those of many other d-SLRs that we looked at. In the other direction, I was quite surprised to see the Nikon D2x place as low on the listings as it did, given that we found that camera's shadow detail to be little short of amazing.
One thing that's going on here though, is that we tested each camera at its lowest ISO setting, which should produce best-case noise levels. This is in fact what many photographers will be most interested in, but it does perhaps place the Nikons at a disadvantage, as their lowest ISO setting is 200, as compared to the ISO 100 settings available on most other models.
Two things do really stand out there though: First, that the A100 places relatively low on the list for from-camera JPEGs. The other obvious point though, is that its dynamic range increases dramatically in the hands of a good RAW converter. We don't have the wherewithal to experiment with a lot of different RAW converters on the cameras we test, but it seems that the A100 may hold a lot of promise as a camera for the RAW shooter. (The results with Adobe Camera Raw suggest that a well-tuned RAW converter would take care of a lot of the contrastiness that bothered me in shooting with it, making it into a really fine photographic tool.)
As I always say though, at the end of the day, I think you have to take the figures here with a grain of salt, and look at actual images with your own eyes to see what you make of each camera's tonal range and noise levels. We'll continue performing these dynamic range tests on the digital SLRs that we review, but (just as with the laboratory resolution target results), we suggest that you not rely on them exclusively for making your purchase decisions.
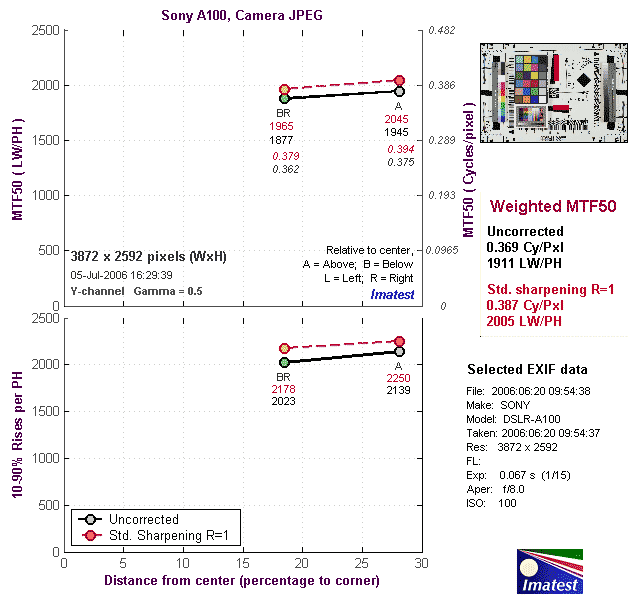
The chart above shows consolidated results from spatial frequency response measurements in both the horizontal and vertical axes. The "MTF 50" numbers tend to correlate best with visual perceptions of sharpness, so those are what I focus on here. The uncorrected resolution figures are 1945 line widths per picture height in the horizontal direction (corresponding to the vertically-oriented edge), and 1877 along the vertical axis (corresponding to the horizontally-oriented edge), for a combined average of 1911 LW/PH. Correcting to a "standardized" sharpening with a one-pixel radius increases this number a modest amount, to an average of 2005 LW/PH, an excellent level for a ~10 megapixel camera.
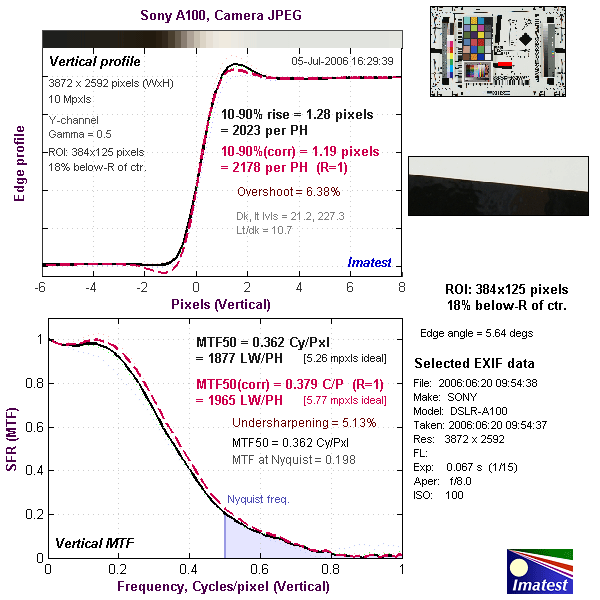
For the real techno-geeks, the two plots below show the actual edge response of the Sony A100, for horizontal and vertical edges. Here, we can see that the camera's default sharpening does produce a slight bump in the edge profiles, in both vertical and horizontal directions. This will make its images straight from the camera look a little crisper to the eye, although it does introduce relatively slight "halo" artifacts around sharp edges. From past experience and from closely inspecting the A100's test images, we can say that the size (both height and extent) of the bump with the A100's default sharpening setting is just about ideal. The images are crisped-up very nicely, but little or no fine detail is lost to the sharpening process.

 Fujifilm GFX 50S Review
 Fujifilm X-T3 Review
 Olympus E-M5 III Review

Follow Imaging Resource