Sony A500 Imatest Results
We routinely use Norman Koren's excellent "Imatest" analysis program for quantitative, thoroughly objective analysis of digicam test images. I highly recommend it to our technically-oriented readers, as it's far and away the best, most comprehensive analysis program I've found to date.
My comments below are just brief observations of what we see in the Imatest results. A full discussion of all the data Imatest produces is really beyond the scope of this review: Visit the Imatest web site for a full discussion of what the program measures, how it performs its computations, and how to interpret its output.
Here's some of the results produced by Imatest for the Sony A500:
sRGB Accuracy Comparison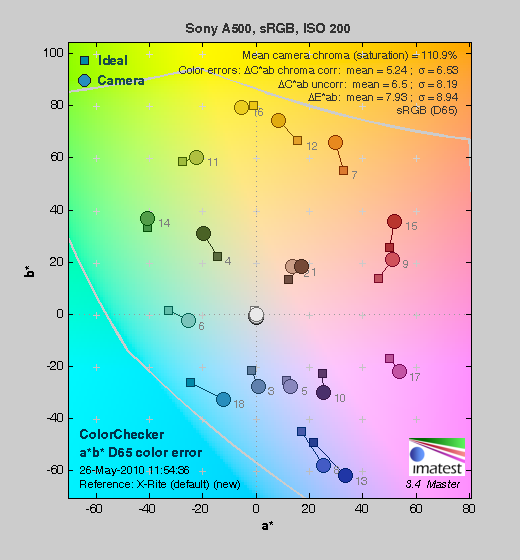 |
||||
The Sony A500 showed generally good color accuracy, with only minor oversaturation of bright reds, dark greens and deep blues, and to a lesser extent, some oranges, purples and browns. Hue accuracy was also generally good, with the typical (typical meaning significant) cyan shift we see in most cameras we test, and also a little shift in some oranges and yellows. Average saturation for the Sony A550 was 110.9% (oversaturated by 10.9%, mostly in the colors mentioned previously). Average "delta-C" color error was 5.24 after correction for saturation, which puts it near the top tier. (Delta-C is the same as the more commonly referred to delta-E, but delta-C takes into account only color differences, ignoring luminance variation.) All in all, a very good color response for this class of camera. Mouse over the links below the illustration above to compare results with similarly priced SLRs.
Adobe RGB Accuracy Comparison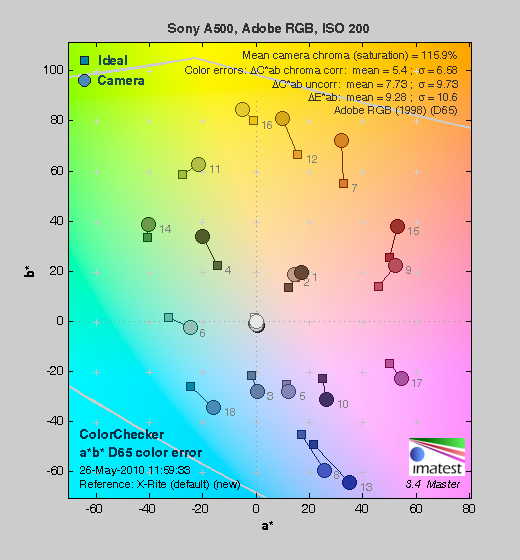 |
||||
Most SLRs dramatically oversaturate colors when shooting in Adobe RGB mode, and the Sony A550 follows suit. Average saturation was 115.9%, and average saturation-corrected hue error was 5.4 "delta-C" units, just slightly less accurate than the sRGB result. Again, mouse over the links below the illustration above to compare results with other SLRs.
Sony A500 Color Analysis
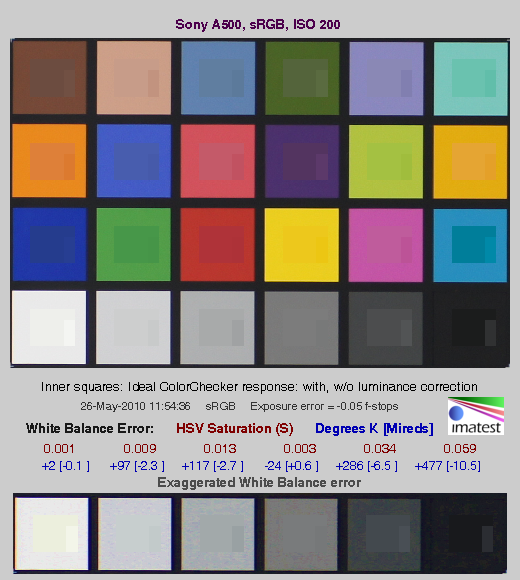
This image shows how the Sony A500 actually rendered the colors of the MacBeth chart, compared to a numerically ideal treatment. In each color swatch, the outer perimeter shows the color as actually captured by the camera, the inner square shows the numerically correct color after correcting for the luminance of the photographed chart (as determined by a second-order curve fit to the values of the gray swatches), and the small rectangle inside the inner square shows the numerically correct color, without the luminance correction. This image shows the very good hue accuracy of the Sony A500, and also a tendency to boost the brightness (luminance) of highly saturated colors. We we've observed this brightness boost in many cameras we've tested; it seems to be a way to get brighter-looking color without completely overdoing the saturation. In the neutrals, the A500 produces very slightly cool colors. Overall, the colors are impressively close to their "correct" values.
Sony A500 Noise Analysis
As always, there's more in this particular graph than we really have room to go into here. (Also note that this set of plots has also changed a few revisions back in Imatest. Some of the plots that were once shown here are now shown in other Imatest output. Since we largely focus on the Noise Spectrum plot, we only show the graphic above, which includes that plot.)
In comparing these graphs with those from competing cameras, we've found that the Noise Spectrum graph at lower right is often the most important. Cameras that manage to shift their noise spectrum to higher frequencies have much finer-grained noise structures, making their noise less visually objectionable. In the graph above, this would show up as a noise spectrum curve that remained higher on the right side, representing higher noise frequencies.
In the case of the Sony A500, we find a fairly typical response from a good APS-C sensor. The luminance noise is fairly fine-grained, with very little rise in the noise spectrum at low frequencies. If anything, the luminance noise levels at low frequencies is slightly below the average slope of the line. On the other hand, the color channels (especially the red and blue ones) have a lot of energy lumped up on the low-frequency side of the curve. This is typical for a Bayer sensor. The bottom line on the A500 is that noise is quite low at ISO 200, regardless of the frequency distribution, and not visible except when doing extreme pixel-peeping in darker tones and shadows.
Above is the same set of noise data at ISO 1,600. Here, the overall Noise Spectrum graph is shifted a fair bit toward the left-hand, lower-frequency side than it was at ISO 200, coarsening the "grain" of the image noise patterns, but there's much less difference between the color channels in this plot with chrominance tracking the luminance noise much more closely. Only at the lowest frequencies is color channel noise elevated compared to luminance noise. In the past, it's been unusual to find a greater difference between chroma and luminance noise at lower ISOs than at higher ones, although it's becoming more common. Overall noise levels here are pretty much on par with other SLRs using APS-C size sensors.
Here's the same set of noise data at ISO 3,200. Here again, the Noise Spectrum graph is shifted even more toward the left-hand side, further coarsening the "grain" of the image noise patterns further. Overall noise levels are good, though; the Sony A500 is holding its own against other SLRs in its class. Looking at the curve in the lower left, the total noise is higher than some competitors in the deepest shadows (far left side of the curve), but pretty competitive otherwise.
This chart compares the Sony A500's noise performance over a range of ISOs against that of other SLR cameras in its class. While we continue to show noise plots of this sort because readers ask for them, we each time point out that the noise magnitude is only a small part of the story, the grain pattern being much more important, not to mention what the camera does to achieve a given noise level. (Some cameras obliterate subject detail along with noise, so the camera with the lowest noise levels on MacBeth chart swatches may not necessarily produce the most appealing images.)
Here, we can see the Sony A500's luminance noise levels are lower than most of the group, except for the Sony NEX-5 and the Nikon D5000 at ISOs above 1,600. Overall, levels are very similar to its more expensive sibling, the 14-megapixel Sony A550. What's not shown, though, is that noise reduction is much better than previous generation Alphas which tended to blur away too much fine detail along with noise, thus scoring better on graphs like these. On previous models like the A380 and A350, there would be quite a dip in the curve at ISO 1,600 where strong noise reduction kicked in. We much prefer the A500's approach of preserving detail while leaving a bit more noise. The less heavy-handed noise reduction is a real step in the right direction for Sony.
Sony A500 Dynamic Range Analysis
A key parameter in a digital camera is its Dynamic Range, the range of brightness that can be faithfully recorded. At the upper end of the tonal scale, dynamic range is dictated by the point at which the RGB data "saturates" at values of 255, 255, 255. At the lower end of the tonal scale, dynamic range is determined by the point at which there ceases to be any useful difference between adjacent tonal steps. Note the use of the qualifier "useful" in there: While it's tempting to evaluate dynamic range as the maximum number of tonal steps that can be discerned at all, that measure of dynamic range has very little relevance to real-world photography. What we care about as photographers is how much detail we can pull out of the shadows before image noise becomes too objectionable. This, of course, is a very subjective matter, and will vary with the application and even the subject matter in question. (Noise will be much more visible in subjects with large areas of flat tints and subtle shading than it would in subjects with strong, highly contrasting surface texture.)
What makes most sense then, is to specify useful dynamic range in terms of the point at which image noise reaches some agreed-upon threshold. To this end, Imatest computes a number of different dynamic range measurements, based on a variety of image noise thresholds. The noise thresholds are specified in terms of f-stops of equivalent luminance variation in the final image file, and dynamic range is computed for noise thresholds of 1.0 (low image quality), 0.5 (medium image quality), 0.25 (medium-high image quality) and 0.1 (high image quality). For most photographers and most applications, the noise thresholds of 0.5 and 0.25 f-stops are probably the most relevant to the production of acceptable-quality finished images, but many noise-sensitive shooters will insist on the 0.1 f-stop limit for their most critical work.
The image below shows the test results from Imatest for an in-camera JPEG file from the Sony A500 with a nominally-exposed density step target (Stouffer 4110), and its settings such as DRO and HDR turned off.
Here, we can see that the tone curve maintains excellent gradation in the highlights though the shadow end trails off much more abruptly. These results put the A500 in the middle of the pack of SLRs with APS-C sensors.
Once again, it would be easy to dismiss this performance, if it turned out that Sony's anti-noise processing was wiping out subject detail in the process: But that's not what's happening; the Sony A500 does a pretty good job of preserving subtle subject detail, far more so than previous generations of Alphas.
Processing the Sony A500's RAW (.ARW) files through Adobe Camera Raw (ACR) version 5.7 increased dynamic range by more than an f-stop at the highest quality level (8.56 f-stops) compared to the best in-camera JPEG (7.34 f-stops), while total dynamic range reported increased from 9.55 to 10.9 f-stops. These results were obtained by using ACR's automatic settings and then tweaking from there. It's worth noting here that ACR's default noise reduction settings reduced overall noise (see the plot in the lower left-hand corner) relative to the levels in the in-camera JPEG, which would tend to boost the dynamic range numbers for the High Quality threshold. Also, the extreme highlight recovery being performed by ACR here would likely produce color errors in strong highlights of natural subjects.
Dynamic Range, the bottom line:
The net result was that the Sony A500 showed good dynamic range for its class, though scores were not quite as good as its more expensive sibling, the A550.
To get some perspective, here's a summary of the Sony A500's dynamic range performance, and how it compares to other digital SLRs that we also have Imatest dynamic range data for. (Results are arranged in order of decreasing dynamic range at the "High" quality level.):
| Dynamic Range (in f-stops) vs Image Quality (At camera's base ISO) (Blue = RAW via ACR, Yellow=Camera JPEG, Green=Current Camera) |
||||
| Model | 1.0 (Low) |
0.5 (Medium) |
0.25 (Med-High) |
0.1 (High) |
| Nikon D3X (Adobe Camera Raw 5.3b) |
-- | -- | 11.1 | 9.64 |
| Nikon D3S (Adobe Camera Raw 5.6) |
-- | -- | 10.7 | 9.55 |
| Nikon D700 (Adobe Camera Raw 4.5) |
12.1 | 11.6 | 10.6 | 9.51 |
| Nikon D5000 (Adobe Camera Raw 5.4b) |
-- | 11.6 | 10.8 | 9.50 |
| Sony A900 (Adobe Camera Raw 4.6b) |
-- | 12.1 | 10.7 | 9.36 |
| Pentax K-x (Adobe Camera Raw 5.6b) |
11.5 | 11.2 | 10.7 | 9.33 |
| Nikon D90 (Adobe Camera Raw 4.6b) |
12.1 | 11.8 | 10.7 | 9.27 |
| Fujifilm S3 Pro (Adobe Camera Raw 2) |
12.1 | 11.7 | 10.7 | 9.00 |
| Sony A230 (Adobe Camera Raw 5.5) |
11.7 | 11.1 | 10.1 | 8.95 |
| Nikon D40x (Adobe Camera Raw 4.1) |
12.0 | 10.9 | 10.3 | 8.90 |
| Nikon D300S (Adobe Camera Raw 5.5) |
-- | 11.3 | 10.4 | 8.89 |
| Canon 5D Mark II (Adobe Camera Raw 5.2) |
-- | 10.8 | 10.0 | 8.89 |
| Sony A330 (Adobe Camera Raw 5.4) |
-- | -- | 10.1 | 8.86 |
| Canon EOS-1Ds Mark III (Adobe Camera Raw 4.5) |
11.5 | 10.7 | 9.96 | 8.84 |
| Nikon D3 (Adobe Camera Raw 4.5) |
11.7 | 11.0 | 10.0 | 8.75 |
| Canon EOS-1D Mark III (Adobe Camera Raw 4.5) |
11.7 | 10.7 | 9.99 | 8.73 |
| Sony A550 (Adobe Camera Raw 5.7) |
-- | -- | 10.3 | 8.72 |
| Sony A380 (Adobe Camera Raw 5.5) |
11.8 | 10.9 | 10.1 | 8.62 |
| Nikon D3000 (Adobe Camera Raw 5.5) |
-- | 10.8 | 10.1 | 8.61 |
| Sony A500 (Adobe Camera Raw 5.7) |
10.9 | 10.6 | 9.87 | 8.56 |
| Pentax K20D (Adobe Camera Raw 4.5) |
11.4 | 10.6 | 9.82 | 8.56 |
| 8.5 Stops | ||||
| Nikon D300 (Adobe Camera Raw 4.3.1) |
11.4 | 10.9 | 9.87 | 8.45 |
| Sony A200 (Adobe Camera Raw 4.3.1) |
11.6 | 10.4 | 9.82 | 8.43 |
| Nikon D60 (Adobe Camera Raw 4.4.1) |
11.6 | 10.5 | 9.74 | 8.31 |
| Nikon D40 (Adobe Camera Raw 4.1) |
11.9 | 10.9 | 9.89 | 8.30 |
| Canon EOS-1Ds Mark III (Camera JPEG) |
10.9 | 10.2 | 9.71 | 8.23 |
| Pentax K100D (Adobe Camera Raw 3.6) |
11.3 | 10.3 | 9.51 | 8.23 |
| Pentax K200D (Adobe Camera Raw 4.4.1) |
-- | 10.5 | 9.54 | 8.19 |
| Pentax K10D (Adobe Camera Raw 3.7) |
10.6 | 10.0 | 9.29 | 8.19 |
| Canon 7D (Adobe Camera Raw 5.6) |
11.2 | 10.3 | 9.52 | 8.18 |
| Sony A100 (Adobe Camera Raw 3.4) |
11.3 | 10.5 | 9.69 | 8.16 |
| Canon EOS-1Ds Mark II (Adobe Camera Raw 3) |
11.2 | 10.3 | 9.40 | 8.14 |
| Canon EOS 50D (Adobe Camera Raw 4.6) |
11.2 | 10.5 | 9.49 | 8.06 |
| Nikon D40x (Camera JPEG) |
10.8 | 10.0 | 9.42 | 8.04 |
| Olympus E-P1 (ISO 200, Adobe Camera Raw 5.5) |
11.5 | 10.4 | 9.26 | 8.04 |
| Canon Rebel XSi (Camera JPEG) (ALO on by default) |
11.3 | 10.1 | 9.34 | 8.01 |
| 8.0 Stops | ||||
| Nikon D3S (Camera JPEG) |
-- | -- | -- | 7.96 |
| Fujifilm S3 Pro (Camera JPEG) |
-- | 9.90 | 9.40 | 7.94 |
| Canon T2i (Adobe Camera Raw 5.7) |
-- | 10.0 | 9.21 | 7.94 |
| Samsung NX10 (Adobe Camera Raw 5.7 beta) |
-- | -- | 9.18 | 7.91 |
| Sony A350 (Adobe Camera Raw 4.4) |
11.6 | 10.5 | 9.61 | 7.89 |
| Canon EOS-1D Mark III (Camera JPEG) |
-- | 10.2 | 9.70 | 7.88 |
| Olympus E-P2 (Adobe Camera Raw 5.6) |
-- | 10.2 | 9.44 | 7.88 |
| Canon Rebel XS (Adobe Camera Raw 4.5) |
-- | 10.3 | 9.27 | 7.88 |
| Nikon D3 (Camera JPEG) |
-- | -- | -- | 7.87 |
| Canon Digital Rebel XTi (Adobe Camera Raw 3.6) |
10.8 | 9.88 | 9.18 | 7.84 |
| Canon EOS 5D (Adobe Camera Raw 3) |
11.0 | 10.4 | 9.21 | 7.83 |
| Nikon D90 (Camera JPEG) |
-- | -- | -- | 7.77 |
| Panasonic DMC-GH1 (Adobe Camera Raw 5.4b) |
9.88 | -- | 9.30 | 7.76 |
| Canon Rebel T1i (Adobe Camera Raw 5.4b) |
11.2 | 10.2 | 9.16 | 7.73 |
| Pentax K-7 (Adobe Camera Raw 5.4) |
10.6 | 9.93 | 9.07 | 7.73 |
| Canon EOS 40D (Adobe Camera Raw 4.2) |
11.2 | 10.1 | 9.26 | 7.72 |
| Panasonic DMC-GH1 (Camera JPEG) |
8.77 | -- | -- | 7.70 |
| Canon Rebel XSi (Adobe Camera Raw 4.4.1) |
10.6 | 9.95 | 9.10 | 7.68 |
| Canon EOS 50D (Camera JPEG) (ALO STD by default) |
-- | -- | 8.90 | 7.68 |
| Nikon D700 (Camera JPEG) |
-- | -- | 9.05 | 7.67 |
| Canon 5D Mark II (Camera JPEG) (ALO STD by default) |
10.6 | 9.68 | 8.98 | 7.66 |
| Nikon D5000 (Camera JPEG) |
-- | -- | 8.96 | 7.65 |
| Canon EOS-5D (Camera JPEG) |
10.2 | 9.68 | 8.82 | 7.65 |
| Olympus E-3 (Adobe Camera Raw 4.3) |
10.3 | 10.1 | 9.29 | 7.64 |
| Nikon D60 (Camera JPEG) |
10.5 | 9.62 | 8.89 | 7.62 |
| Nikon D200 (Adobe Camera Raw 3) |
10.6 | 9.65 | 8.96 | 7.61 |
| Sony A550 (Camera JPEG) (DRO Auto by default) |
10.5 | 9.90 | 8.87 | 7.61 |
| Sony NEX-5 (Camera JPEG) |
10.4 | 9.64 | 8.82 | 7.57 |
| Canon 7D (Camera JPEG) (ALO STD by default) |
-- | 9.70 | 8.54 | 7.54 |
| Canon T2i (Camera JPEG) |
-- | 9.44 | 8.45 | 7.53 |
| Nikon D80 (Adobe Camera Raw 3.6) |
11.1 | 10.4 | 9.42 | 7.51 |
| 7.5 Stops | ||||
| Nikon D300S (Camera JPEG) |
-- | -- | -- | 7.49 |
| Olympus E-500 (Adobe Camera Raw 3) |
10.7 | 9.97 | 8.90 | 7.46 |
| Olympus E-510 (Adobe Camera Raw 4.1) |
10.0 | 9.43 | 8.64 | 7.46 |
| Pentax K10D (Camera JPEG) |
-- | 9.49 | 8.88 | 7.44 |
| Sony NEX-3 (Camera JPEG) |
10.0 | 9.62 | 8.86 | 7.44 |
| Nikon D300 (Camera JPEG) |
-- | -- | 8.70 | 7.44 |
| Olympus E-420 (Adobe Camera Raw 4.1.1) |
10.0 | 9.61 | 8.65 | 7.44 |
| Canon Rebel T1i (Camera JPEG) (ALO=STD by default) |
11.3 | 10.1 | 9.34 | 7.43 |
| Nikon D2Xs (Adobe Camera Raw 3.6) |
10.6 | 9.90 | 8.93 | 7.42 |
| Canon EOS 40D (Camera JPEG) |
10.6 | 9.52 | 8.78 | 7.42 |
| Olympus E-PL1 (Adobe Camera Raw 5.7) |
10.4 | 9.89 | 8.76 | 7.39 |
| Nikon D3X (Camera JPEG) |
-- | -- | -- | 7.37 |
| Nikon D50 (Camera JPEG) |
10.7 | 9.93 | 8.70 | 7.36 |
| Panasonic DMC-G2 (Adobe Camera Raw 5.7) |
10.3 | 9.87 | 8.77 | 7.35 |
| Sony A500 (Camera JPEG) |
9.53 | 9.21 | 8.64 | 7.34 |
| Sony A380 (Camera JPEG) (DRO Standard by default) |
-- | 9.54 | 8.84 | 7.32 |
| Panasonic DMC-G1 (Adobe Camera Raw 5.2) |
10.7 | 9.78 | 8.70 | 7.32 |
| Nikon D3000 (Camera JPEG) |
10.2 | 9.64 | 8.69 | 7.31 |
| Sony A900 (Camera JPEG) (DRO off by default ) |
10.2 | 9.75 | 8.49 | 7.31 |
| Sony A330 (Camera JPEG) (DRO Standard by default) |
10.1 | 9.37 | 8.59 | 7.30 |
| Sony A200 (Camera JPEG) (DRO on by default) |
10.4 | 9.43 | 8.91 | 7.29 |
| Canon EOS 20D (Camera JPEG) |
10.3 | 9.66 | 8.85 | 7.29 |
| Canon EOS 30D (Camera JPEG) |
10.3 | 9.50 | 8.57 | 7.29 |
| Nikon D40 (Camera JPEG) |
10.4 | 9.80 | 8.89 | 7.28 |
| Sony A230 (Camera JPEG) (DRO Standard by default) |
10.1 | 9.51 | 8.51 | 7.26 |
| Sony A900 (Camera JPEG) (DRO on) |
10.1 | 9.76 | 8.47 | 7.26 |
| Canon Rebel XS (Camera JPEG) |
10.3 | 9.4 | 8.61 | 7.22 |
| Olympus E-520 (Adobe Camera Raw 4.5) |
11.0 | 9.46 | 8.70 | 7.20 |
| Sony A350 (Camera JPEG) (DRO on by default) |
10.3 | 9.55 | 8.85 | 7.19 |
| Pentax K-x Camera JPEG |
9.99 | 8.94 | 8.31 | 7.18 |
| Panasonic DMC-GF1 (Adobe Camera Raw 5.5) |
10.2 | 9.62 | 8.62 | 7.16 |
| Nikon D80 (Camera JPEG) |
10.1 | 9.43 | 8.48 | 7.12 |
| Canon Digital Rebel XT (Camera JPEG) |
10.3 | 9.51 | 8.61 | 7.11 |
| Nikon D200 (Camera JPEG) |
-- | 9.07 | 8.36 | 7.11 |
| Olympus E-300 (Camera JPEG) |
10.8 | 9.26 | 8.48 | 7.07 |
| Olympus E-410 (Adobe Camera Raw 4.1) |
10.2 | 9.40 | 8.24 | 7.05 |
| Olympus E-500 (Camera JPEG) |
10.0 | 9.14 | 8.16 | 7.05 |
| Canon Digital Rebel XTi (Camera JPEG) |
9.83 | 9.10 | 8.27 | 7.04 |
| Canon EOS-1Ds Mark II (Camera JPEG) |
10.3 | 9.38 | 8.60 | 7.04 |
| Panasonic DMC-G1 (Camera JPEG) |
-- | 9.33 | 8.52 | 7.03 |
| Pentax K200D (Camera JPEG) |
-- | 9.50 | 8.30 | 7.01 |
| 7.0 Stops | ||||
| Panasonic DMC-GF1 (Camera JPEG) |
-- | 9.33 | 8.44 | 6.99 |
| Canon Digital Rebel (Camera JPEG) |
10.1 | 9.11 | 8.47 | 6.97 |
| Nikon D2Xs (Camera JPEG) |
9.82 | 8.98 | 8.23 | 6.97 |
| Panasonic DMC-L10 (Adobe Camera Raw 4.2) |
10.4 | 9.34 | 8.48 | 6.91 |
| Sigma DP1 (Camera JPEG) |
-- | 8.95 | 8.13 | 6.91 |
| Pentax *istDs (Camera JPEG) |
10.2 | 10.0 | 8.87 | 6.90 |
| Sony A100 (Camera JPEG) |
10.2 | 9.24 | 8.39 | 6.89 |
| Samsung NX10 (Camera JPEG, Smart Range, ISO 200) |
10.1 | 8.99 | 8.22 | 6.78 |
| Pentax K100D (Camera JPEG) |
10.3 | 9.30 | 8.39 | 6.73 |
| Panasonic DMC-G2 (Camera JPEG) |
9.72 | 9.18 | 8.15 | 6.68 |
| Pentax K20D (Camera JPEG) |
10.2 | 9.21 | 8.09 | 6.66 |
| Pentax K-7 (Camera JPEG) |
9.59 | 8.87 | 8.03 | 6.54 |
| 6.5 Stops | ||||
| Nikon D2x (Camera JPEG) |
-- | 8.93 | 7.75 | 6.43 |
| Olympus E-3 (Camera JPEG) |
9.32 | 9.06 | 8.50 | 6.42 |
| Panasonic DMC-L10 (Camera JPEG) |
-- | 8.94 | 8.00 | 6.38 |
| Olympus E-420 (Camera JPEG) |
9.18 | 8.82 | 7.93 | 6.37 |
| 6.0 Stops | ||||
| Olympus E-410 (Camera JPEG) |
-- | -- | 7.60 | 5.99 |
| Olympus E-PL1 (Camera JPEG, Gradation = Normal) |
-- | 8.63 | 7.45 | 5.89 |
| Samsung NX10 (Camera JPEG) |
9.32 | 8.48 | 7.46 | 5.88 |
| Nikon D70s (Camera JPEG) |
9.84 | 8.69 | 7.46 | 5.85 |
| Nikon D70 (Camera JPEG) |
9.81 | 8.76 | 7.58 | 5.84 |
| Olympus E-520 (Camera JPEG) |
9.32 | 8.68 | 7.74 | 5.74 |
| Olympus E-P2 (Camera JPEG, Gradation = Normal) |
10.1 | 8.83 | 7.78 | 5.58 |
| Olympus E-P1 (Camera JPEG, Gradation = Normal) |
-- | 8.85 | 7.74 | 5.47 |
Note that this test is repeatable to within 1/3 EV according to the Imatest website, so differences of less than 0.33 can be ignored.
Sony A500 Resolution Chart Test Results
The chart above shows consolidated results from spatial frequency response measurements in both the horizontal and vertical axes. The "MTF 50" numbers tend to correlate best with visual perceptions of sharpness, so those are what we focus on here. The uncorrected resolution figures are 1,722 line widths per picture height in the horizontal direction (corresponding to the vertically-oriented edge), and 1,620 lines along the vertical axis (corresponding to the horizontally-oriented edge), for a combined average of 1,671 LW/PH. Correcting to a "standardized" sharpening with a one-pixel radius increased both horizontal and vertical numbers, resulting in an average of 1,961 LW/PH. This improvement in the numbers reflects the fact that the A500's in-camera images are technically a bit undersharpened at the default sharpness setting.
To see what's going on, refer to the plots below, which show the actual edge profiles for both horizontal and vertical edges, in both their original and corrected forms. Here, you can see that a somewhat conservative amount of in-camera sharpening is applied in both the horizontal and vertical directions (undersharpened according to Imatest's calculations by 9.54% and 13.7%, respectively). You can always turn up the sharpening in-camera, but better results can be usually be achieved by actually turning down the in-camera sharpening, then sharpening post-exposure in Adobe Photoshop or other image editing software, or by shooting RAW so that all sharpening is under your control.
Note: We don't feature SFR-based LW/PH resolution numbers more prominently in our reviews (eg, outside the Imatest pages) because we've found that they're *very* sensitive to minor differences in in-camera image processing. Relatively small changes in the amount of in-camera sharpening can have a large effect on the resulting resolution numbers. Imatest attempts to compensate for this by adjusting to a "standard" sharpening, but this approach can't completely undo what happens inside the cameras, and so often gives inconsistent results. Sometimes the "standardized" sharpening happens to just match the shape of the edge profile with the in-camera sharpening applied, and you'll get wildly high results. At other times, it will tend to correct in the opposite direction. Unfortunately, ignoring the in-camera sharpening entirely can result in even greater discrepancies, particularly between models from different manufacturers. Turning off sharpening in the camera may or may not fully eliminate the sharpening, so simply turning off sharpening in the camera JPEGs isn't a reliable solution. It also wouldn't be the way most people shoot the cameras. We could process RAW files with no sharpening (as shown below), but then that'd only suit the people working primarily or exclusively from RAW, and would open another can of worms as to what RAW converter was used, etc, etc.
The bottom line is that numbers for resolution only take you so far. Detail handling and edge acuity are very complex issues; ones that don't easily boil down to a single number. The best approach is to simply look look at the broad array of standardized test shots we take with each camera, to the point of downloading and printing them with whatever processing you'd use if you owned the camera and shot with it. See how the differences stack up for you visually, and make your decision on that, rather than on abstract resolution numbers.
 Fujifilm GFX 50S Review
 Fujifilm X-T3 Review
 Olympus E-M5 III Review

Follow Imaging Resource