Nikon Coolpix 8400By: Shawn Barnett & Dave Etchells(none) <<8400 Sample Images :(Previous) | (Next): Print-Friendly Review Version>> 8400 Imatest ResultsReview First Posted: 09/16/2004, Updated: 12/13/2004 |
Detailed analysis of the Nikon Coolpix 8400 images, from Imatest(tm)
I've recently begun using Norman Koren's excellent "Imatest" analysis program for quantitative, thoroughly objective analysis of digicam test images. I highly commend it to our technically-oriented readers, as it's far and away the best, most comprehensive analysis program I've found to date. (And with an introductory price of only $59, it's hard to beat.)
My comments below are just brief observations of what I see in the Imatest results. A full discussion of all the data Imatest produces is really beyond the scope of this review: Visit the Imatest web site for a full discussion of what the program measures, how it performs its computations, and how to interpret its output.
Here's some of the results produced by Imatest for the Nikon Coolpix 8400:
Color Accuracy
Like most consumer/prosumer cameras, and even many SLRs, the Nikon 8400 tends
to oversaturate colors somewhat. The 8400 differs though, in that it doesn't
oversaturate pure reds quite as much as most, but oversaturates strong blues
more than average. Bright greens are also quite strong. The overall effect
in its images isn't bad, but its colors do appear a bit more intense than
average. On average, color saturation of swatches on the MacBeth ColorChecker(tm)
chart are 116.1% of their ideal values. (An average oversaturation of 16.1%.)
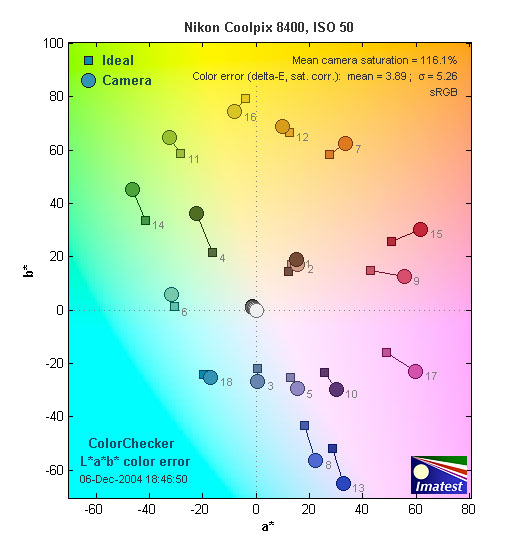
Color Analysis

These images show the color behavior of the Nikon Coolpix 8400 directly. In
each color swatch, the outer perimeter shows the color as actually captured
by the camera, the inner square shows the color after correcting for the luminance
of the photographed chart (as determined by a 2nd-order curve fit to the values
of the gray swatches), and the small rectangle inside the inner square shows
what the color should actually be, based on perfect rendering to the sRGB color
spacer. From this plot, we can see that the Nikon 8400 not only boosts saturation
somewhat, but renders highly-saturated colors somewhat brighter than they are
in real life. As noted above, the net result in its photos isn't unappealing
(depending of course on your tastes), but there's no question that its colors
are a fair bit brighter than average. (It's interesting to note though, that
less-saturated colors are rendered much more accurately. This helps the camera
do a good job on skin tones, not over-emphasizing reds or yellows as do some
cameras with "hot" color rendering.)
Gray Patch Tone and Noise Analysis
There's a lot in this particular graph, a lot more than I have room to go into
here. Bottom line, the Coolpix 8400's noise levels are quite low at ISO 50,
with significant high-frequency content, which gives the noise a very fine-grained
characteristic that minimizes its visual impact. (You can see the high-frequency
nature of its noise by the gentle slope on the Noise Spectrum plot above.)
I don't usually bother showing a second noise graph for the cameras I test,
but in the case of the Nikon 8400, I thought it would be instructive. At higher
ISOs, its noise develops a much coarser "grain" pattern, making it
much more objectionable. What's interesting here is that the Imatest Noise Spectrum
plot above shows this quite directly, with more of a bulge on the left (low
frequency) side of the graph, and a more rapid falloff on the right (high frequency)
side.
This chart compares the Nikon Coolpix 8400's noise performance over a range
of ISOs against that of competing cameras. As you can see, the Nion 8400 and
Sony DSC-F828 have very similar performance. (The 8400's big brother, the Coopix
8800 is also shown on this plot. As you can see, the 8400's noise levels are
slightly lower than those of the 8800 at low ISOs, slightly higher at ISO 400.)
The Olympus C-8080 and Konica Minolta DiMAGE A2 both show lower noise magnitudes.
What this plot doesn't show though, is how the cameras are achieving
their noise levels. In the case of the 8080 and A2, both cameras use more aggressive
noise-suppression processing than do the Nikon 8400 or Sony F828. The result
is that their noise levels are lower, but they lose more detail in image areas
with subtle contrast.
The chart above shows consolidated results from spatial frequency response
measurements in both the horizontal and vertical axes. The "MTF 50"
numbers tend to correlate best with visual perceptions of sharpness, so those
are what I focus on here. The uncorrected resolution figures are 1380 line widths
per picture height in the horizontal direction (corresponding to the vertically-oriented
edge), and 1391 along the vertical axis (corresponding to the horizontally-oriented
edge), for a combined average of 1386 LW/PH. Correcting to a "standardized"
sharpening with a one-pixel radius increases this number slightly, to an average
of 1519 LW/PH, a very good number. (Very slightly lower resolution than I found
with the Coolpix 8800, which came in at a corrected average of 1559 LW/PH.)
For the real techno-geeks, the two plots below show the actual edge response
of the 8400, for horizontal and vertical edge. What's interesting in these plots
is how restrained the 8400's default sharpening is, and how little it disturbs
the underlying image detail.

Follow Imaging Resource: