Panasonic GF1 Imatest Results
We routinely use Norman Koren's excellent "Imatest" analysis program for quantitative, thoroughly objective analysis of digicam test images. I highly recommend it to our technically-oriented readers, as it's far and away the best, most comprehensive analysis program I've found to date.
My comments below are just brief observations of what we see in the Imatest results. A full discussion of all the data Imatest produces is really beyond the scope of this review: Visit the Imatest web site for a full discussion of what the program measures, how it performs its computations, and how to interpret its output.
Here's some of the results produced by Imatest for the Panasonic GF1:
sRGB Accuracy Comparison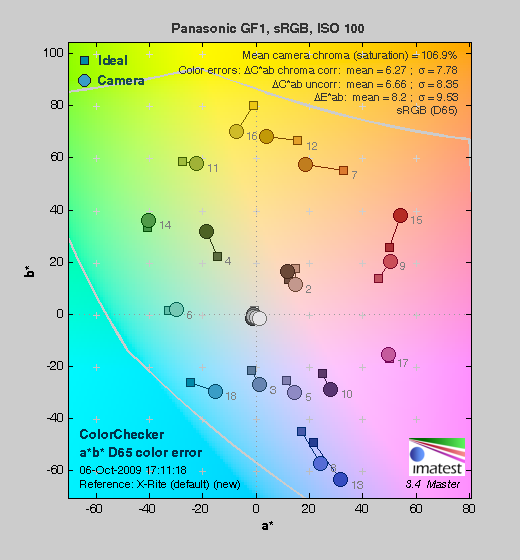 |
|||
The Panasonic DMC-GF1 showed good color accuracy, with only minor oversaturation of bright reds, deep blues, dark greens and some purples. The Lumix GF1 actually undersaturates some yellows, oranges, cyans and greens slightly. Hue accuracy was also generally good, with the typical cyan shift we see in most cameras we test, but a slightly larger than average shift in the range of spectrum from orange through yellow. The shift of oranges toward yellow and yellows toward green was evident in some of our test images, notably those of the Still Life scene. The earlier Lumix G series showed these tendencies as well. Average saturation was 106.9% (oversaturated by 6.9%, mostly in the reds, blues, purples and dark greens). Average "delta-C" color error was 6.27 after correction for saturation, which is pretty good, just a step down from the best cameras we've tested, including the Olympus E-P1. (Delta-C is the same as the more commonly referred to delta-E, but delta-C takes into account only color differences, ignoring luminance variation.) All in all, a good color response for this class of camera, but there is definitely some weakness in the orange through yellow portion of the spectrum. Mouse over the links below the illustration above to compare results with other Micro Four Thirds models.
Adobe RGB Accuracy Comparison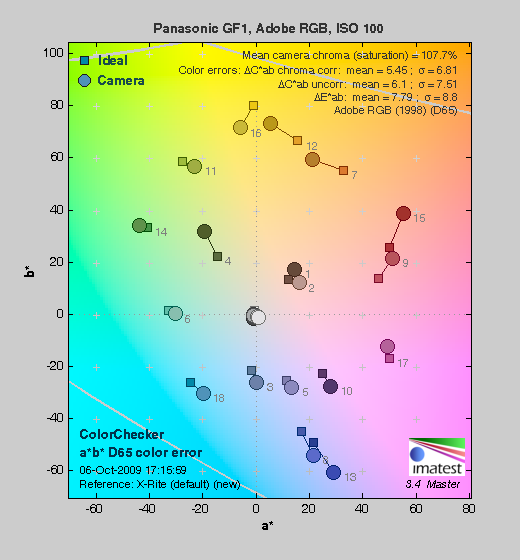 |
|||
As is true of most interchangeable lens cameras, when using the Adobe RGB color space (which provides a much wider gamut, or range of colors that can be expressed), the Panasonic GF1 delivers more highly saturated color, though the increase compared to sRGB is quite minor compared to most cameras we test. Average saturation was 107.7% which is only slightly greater, and average saturation-corrected hue error was 5.45 "delta-C" units, actually slightly more accurate than the sRGB result. Again, mouse over the links below the illustration above to compare results with other Micro Four Thirds models.
The orange-yellow hue shift seen in is one of very few flaws in an otherwise excellent camera, which led us to wonder if there might be a way around it, by processing its images from RAW files, rather than using the camera's JPEGs directly. The Imatest color error plots below show the results with two different RAW converters.
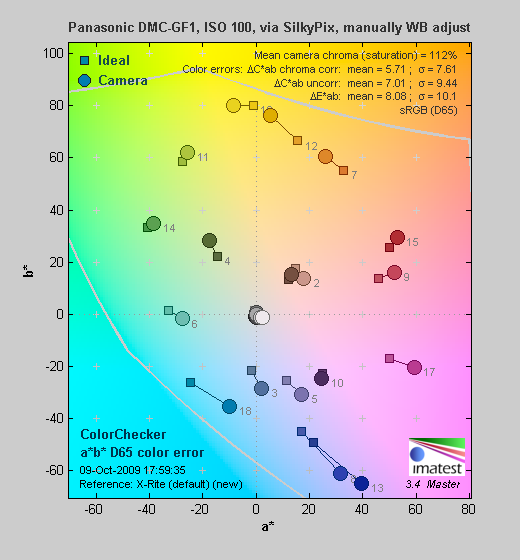
First up is SilkyPix, the RAW converter that Panasonic bundles with their RAW-capable cameras, including the GF1. The plot above is the result of manually tweaking the white balance in SilkyPix to produce neutral greys on the MacBeth chart. Perhaps not surprisingly, the color rendering here is very similar to that implemented in the camera itself, and unfortunately, the problem in the orange-yellow portion of the spectrum is actually somewhat worse.
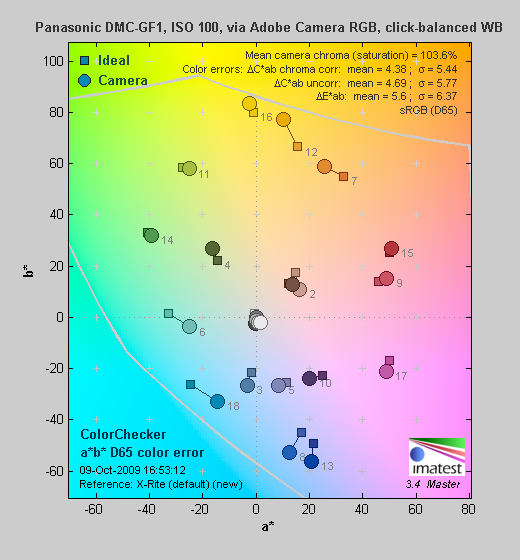
The plot above shows color rendering from Adobe Camera RAW, working from the same RAW file as was used for the SilkyPix example. In this case, white balance was set via the grey-balance click control, from the middle grey of the MacBeth chart. There's still some evidence of the orange-yellow problem, but the bright yellow swatch is much more accurate, with almost no green cast. Saturation of reds, blues, and purples is also much better controlled. With a custom color profile for the camera, you could doubtless get near-perfect color, and even Camera Raw's default rendering delivers overall color accuracy for the Panasonic GF1 that's close to the best we've measured. That's happy news: If you work from RAW anyway (important for extracting maximum detail from most any camera), the GF1's color quirks for the most part become non-issues.
Panasonic GF1 Color Analysis
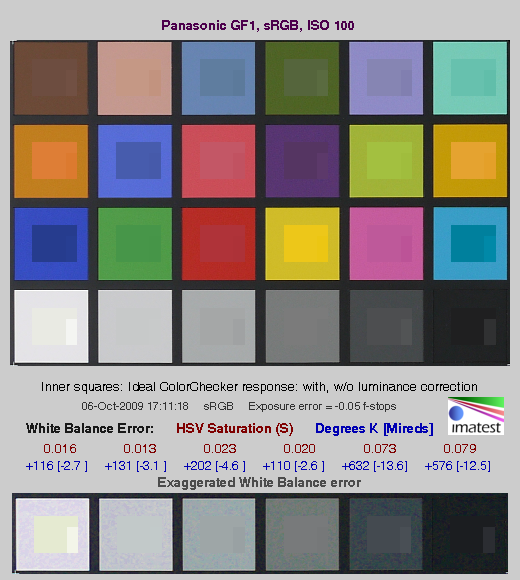
This image shows how the Panasonic GF1 actually rendered the colors of the MacBeth chart, compared to a numerically ideal treatment. In each color swatch, the outer perimeter shows the color as actually captured by the camera, the inner square shows the numerically correct color after correcting for the luminance of the photographed chart (as determined by a second-order curve fit to the values of the gray swatches), and the small rectangle inside the inner square shows the numerically correct color, without the luminance correction. This image shows the generally good hue and saturation accuracy, although the greenish tinge in the bright yellow and orange swatches is quite evident. The as-captured colors are somewhat bright for many blues, but rather dark for some warm tones, notably yellows and oranges. We did notice some yellows were noticeably dull and greenish in some of our test images (see the yellow yarn in our Still Life target), but felt that the overall visual impact of the GF1's color was quite positive. If Panasonic could just clean up their handling of the range of spectrum from orange through yellow-green, the GF1's color would be truly impressive. (The same comment we made for the G1 and GH1 before it.)
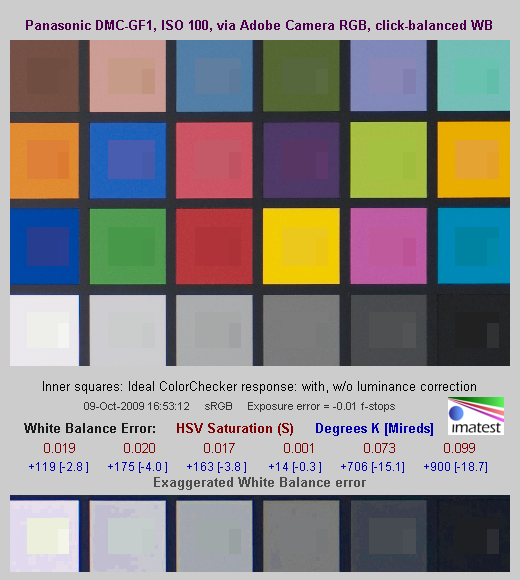
As noted above, though, third-party RAW converters render colors more accurately than does the GF1's own internal processing. The illustration above shows what Adobe Camera Raw's color rendering for the GF1 looks like. The light orange swatch still has a bit of the greenish cast seen in the GF1's JPEGs, but only a hint. Furthermore, the artificially dark tone of the bright yellow and orange swatches is gone, with much luminance much closer to the correct levels: Color accuracy is really excellent overall.
Panasonic GF1 Noise Analysis
 |
|
ISO 100. Row 4, Patch 3 MacBeth patch, magnified 400% (no levels shift). |
 |
|
Row 4, Patch 3 MacBeth patch, magnified 400%, levels adjusted with Photoshop Shadow slider to 100 and Highlights slider to 200 to emphasize ISO 100 chroma noise. |
There's a lot in this particular graph, a lot more than we have room to go into here. (This set of plots has also changed a little in the more recent versions of Imatest. Some of the plots that were shown here previously are now shown in other Imatest output. Since we largely focus on the Noise Spectrum plot, we'll only show the graphic above, which includes that plot.)
In comparing these graphs with those from competing cameras, I've found that the Noise Spectrum graph at lower right is the most important. Cameras that manage to shift their noise spectrum to higher frequencies have much finer-grained noise structures, making their noise less visually objectionable. In the graph above, this would show up as a noise spectrum curve that remained higher on the right side, representing higher noise frequencies.
The Panasonic GF1 does a very good job of keeping a lot of the luminance noise energy (indicated by the black line) up at high frequencies. The low-ISO luminance noise that's there is quite fine-grained as a result. Chroma noise at low spatial frequencies, though, is much higher, especially in the blue and red channels, showing fairly high low-frequency noise bias for a camera in the DSLR category.
When inspecting low ISO GF1 images very closely, you can see blotches of chroma noise in neutral colors, such as the darker gray patches in the MacBeth chart (see the exaggerated example at right - NOTE that this is zoomed 400% over the original file data, and the tone curve has been stretched quite a bit to reveal the noise). The Lumix GF1's noise reduction targets mostly luminance noise at low ISOs.
Above is the same set of noise data at ISO 1,600. Here, the Noise Spectrum graph is shifted quite a bit toward the left-hand, lower-frequency side than it was at ISO 100, coarsening the "grain" of the image noise patterns quite a bit. The red and blue channels still exhibit a bit more noise at the low end of the frequency spectrum, but, are much lower relative to the luminance noise than at lower ISOs, tracking it closely at all but the lowest frequencies. The Panasonic GF1's default noise reduction does a pretty good job at keeping chrominance noise in check at higher ISOs.
Here's the same set of noise data at ISO 3,200. Here again, the Noise Spectrum graph is shifted even more toward the left-hand side, coarsening the "grain" of the image noise patterns further. Note the higher noise values in the top-right and lower-left plots as well.
This chart compares the Panasonic GF1's noise performance over a range of ISOs against that of other Micro Four Thirds models. While we continue to show noise plots of this sort because readers ask for them, we each time point out that the noise magnitude is only a small part of the story, the grain pattern being much more important. Here, we can see that the Panasonic GF1's luminance noise magnitude remains roughly in the middle of the pack relative to its competition at most ISOs. At ISO 1,600, the GF1's noise levels are significantly lower than the Panasonic G1, about the same as the GH1's, and a bit higher than the Olympus E-P1's which uses a similar sensor. At ISO 3,200, the GF1's noise levels are significantly higher than the GH1 and E-P1's, but lower than the G1. Indeed, when we compare GF1 to GH1 images at high ISOs, the GF1 does have a bit more luminance noise (which is probably more visible due to the GF1's slightly higher default sharpening as well). Do keep in mind these measurements are taken with each camera set at default settings, so the shape or position of the curve could be influenced by the settings you choose to use. Like the G1 and GH1, the Panasonic GF1 offers five levels of noise reduction, with the above data collected using the default, middle level.
Micro Four Thirds cameras are only part of the market, of course: Conventional SLRs, whether using the Four Thirds sensor format or more conventional APS-C size sensors, are both more common and generally less expensive. The chart above compares the Panasonic GF1's luminance noise levels with those of conventional SLR models in its same general price bracket. Of the cameras shown, the Olympus E-620 uses a Four Thirds sensor; all the rest have APS-C size chips in them. As you can see, the luminance noise levels of the Panasonic GF1 and E-620 are higher at 1,600 than any of the other models, and significantly higher at ISO 3,200. That said, the GF1 does a much better job than average at maintaining subtle subject detail at higher ISOs, so it deserves some allowance for increased image noise as a result. (Not to give it a complete pass, but we'd personally take the Panasonic GF1's higher luminance noise at ISO 1,600 over that of the Sony A380's default processing any day, given how much more detail the GF1 holds in areas of subtle contrast.)
Panasonic GF1 Dynamic Range Analysis
A key parameter in a digital camera is its Dynamic Range, the range of brightness that can be faithfully recorded. At the upper end of the tonal scale, dynamic range is dictated by the point at which the RGB data "saturates" at values of 255, 255, 255. At the lower end of the tonal scale, dynamic range is determined by the point at which there ceases to be any useful difference between adjacent tonal steps. Note the use of the qualifier "useful" in there: While it's tempting to evaluate dynamic range as the maximum number of tonal steps that can be discerned at all, that measure of dynamic range has very little relevance to real-world photography. What we care about as photographers is how much detail we can pull out of the shadows before image noise becomes too objectionable. This, of course, is a very subjective matter, and will vary with the application and even the subject matter in question. (Noise will be much more visible in subjects with large areas of flat tints and subtle shading than it would in subjects with strong, highly contrasting surface texture.)
What makes most sense then, is to specify useful dynamic range in terms of the point at which image noise reaches some agreed-upon threshold. To this end, Imatest computes a number of different dynamic range measurements, based on a variety of image noise thresholds. The noise thresholds are specified in terms of f-stops of equivalent luminance variation in the final image file, and dynamic range is computed for noise thresholds of 1.0 (low image quality), 0.5 (medium image quality), 0.25 (medium-high image quality) and 0.1 (high image quality). For most photographers and most applications, the noise thresholds of 0.5 and 0.25 f-stops are probably the most relevant to the production of acceptable-quality finished images, but many noise-sensitive shooters will insist on the 0.1 f-stop limit for their most critical work.
The image below shows the test results from Imatest for an in-camera JPEG file from the Panasonic GF1 with a nominally-exposed density step target (Stouffer 4110), and the GF1's settings such as Contrast (0) and iExposure (Off) at their default positions.
Here, we can see that he tone curve shows pretty good gradation in highlights, but the shadow end trails off more abruptly. Dynamic range at the highest quality level is 6.99 f-stops, with 10.5 f-stops overall. These are good numbers for a Four-Thirds sensor, but lag behind results from the larger APS-C sensors most of the competition uses. (Though technically, there is no direct competition in the form of a compact, interchangeable lens camera with an APS-C sized sensor, yet.)
The illustration above shows the results from Adobe Camera Raw 5.5 , with Auto settings (slightly better results are likely possible with manually tweaking, but we weren't able to do much better, due to what appeared to be some truncation of the individual color channel tone curves at the deep shadow end of the tonal range). As can be seen, the score at the highest quality level was only slightly better than the in-camera JPEG, at 7.16 f-stops, while total dynamic range increased from 10.5 to 11.9 f-stops. However, if one ignores the three indistinct steps reported at the deep shadow end, total dynamic range is 10.9 f-stops, also not much of an improvement over JPEG.
Dynamic Range, the bottom line:
The net result was that the Panasonic GF1 showed good dynamic range when compared against other current Four-Thirds models, but lags behind the GH1 as well as most DSLRs with APS-C size sensors. Like we found with the Panasonic GH1, GF1 RAW files processed in Adobe Camera Raw didn't improve Imatest dynamic range scores by very much.
To get some perspective, here's a summary of the Panasonic GF1's dynamic range performance, and how it compares to other digital SLRs that we also have Imatest dynamic range data for. (Results are arranged in order of decreasing dynamic range at the "High" quality level.):
| Dynamic Range (in f-stops) vs Image Quality (At camera's base ISO) (Blue = RAW via ACR, Yellow=Camera JPEG, Green=Current Camera) |
||||
| Model | 1.0 (Low) |
0.5 (Medium) |
0.25 (Med-High) |
0.1 (High) |
| Nikon D3X (Adobe Camera Raw 5.3b) |
-- | -- | 11.1 | 9.64 |
| Nikon D700 (Adobe Camera Raw 4.5) |
12.1 | 11.6 | 10.6 | 9.51 |
| Nikon D5000 (Adobe Camera Raw 5.4b) |
-- | 11.6 | 10.8 | 9.50 |
| Sony A900 (Adobe Camera Raw 4.6b) |
-- | 12.1 | 10.7 | 9.36 |
| Nikon D90 (Adobe Camera Raw 4.6b) |
12.1 | 11.8 | 10.7 | 9.27 |
| Fujifilm S3 Pro (Adobe Camera Raw 2) |
12.1 | 11.7 | 10.7 | 9.00 |
| Nikon D40x (Adobe Camera Raw 4.1) |
12.0 | 10.9 | 10.3 | 8.90 |
| Canon 5D Mark II (Adobe Camera Raw 5.2) |
-- | 10.8 | 10.0 | 8.89 |
| Canon EOS-1Ds Mark III (Adobe Camera Raw 4.5) |
11.5 | 10.7 | 9.96 | 8.84 |
| Nikon D3 (Adobe Camera Raw 4.5) |
11.7 | 11.0 | 10.0 | 8.75 |
| Canon EOS-1D Mark III (Adobe Camera Raw 4.5) |
11.7 | 10.7 | 9.99 | 8.73 |
| Pentax K20D (Adobe Camera Raw 4.5) |
11.4 | 10.6 | 9.82 | 8.56 |
| 8.5 Stops | ||||
| Nikon D300 (Adobe Camera Raw 4.3.1) |
11.4 | 10.9 | 9.87 | 8.45 |
| Sony A200 (Adobe Camera Raw 4.3.1) |
11.6 | 10.4 | 9.82 | 8.43 |
| Nikon D60 (Adobe Camera Raw 4.4.1) |
11.6 | 10.5 | 9.74 | 8.31 |
| Nikon D40 (Adobe Camera Raw 4.1) |
11.9 | 10.9 | 9.89 | 8.30 |
| Canon EOS-1Ds Mark III (Camera JPEG) |
10.9 | 10.2 | 9.71 | 8.23 |
| Pentax K100D (Adobe Camera Raw 3.6) |
11.3 | 10.3 | 9.51 | 8.23 |
| Pentax K200D (Adobe Camera Raw 4.4.1) |
-- | 10.5 | 9.54 | 8.19 |
| Pentax K10D (Adobe Camera Raw 3.7) |
10.6 | 10.0 | 9.29 | 8.19 |
| Sony A100 (Adobe Camera Raw 3.4) |
11.3 | 10.5 | 9.69 | 8.16 |
| Canon EOS-1Ds Mark II (Adobe Camera Raw 3) |
11.2 | 10.3 | 9.40 | 8.14 |
| Canon EOS 50D (Adobe Camera Raw 4.6) |
11.2 | 10.5 | 9.49 | 8.06 |
| Nikon D40x (Camera JPEG) |
10.8 | 10.0 | 9.42 | 8.04 |
| Olympus E-P1 (ISO 200, Adobe Camera Raw 5.5) |
11.5 | 10.4 | 9.26 | 8.04 |
| Canon Rebel XSi (Camera JPEG) (ALO on by default) |
11.3 | 10.1 | 9.34 | 8.01 |
| 8.0 Stops | ||||
| Fujifilm S3 Pro (Camera JPEG) |
-- | 9.90 | 9.40 | 7.94 |
| Nikon D3X (Camera JPEG) Advanced D-Lighting=Low) |
-- | -- | -- | 7.91 |
| Sony A350 (Adobe Camera Raw 4.4) |
11.6 | 10.5 | 9.61 | 7.89 |
| Canon EOS-1D Mark III (Camera JPEG) |
-- | 10.2 | 9.70 | 7.88 |
| Canon Rebel XS (Adobe Camera Raw 4.5) |
-- | 10.3 | 9.27 | 7.88 |
| Nikon D3 (Camera JPEG) |
-- | -- | -- | 7.87 |
| Canon Digital Rebel XTi (Adobe Camera Raw 3.6) |
10.8 | 9.88 | 9.18 | 7.84 |
| Canon EOS 5D (Adobe Camera Raw 3) |
11.0 | 10.4 | 9.21 | 7.83 |
| Canon EOS 50D (Camera JPEG) (ALO Off ) |
-- | 9.64 | 9.17 | 7.83 |
| Nikon D90 (Camera JPEG) |
-- | -- | -- | 7.77 |
| Panasonic DMC-GH1 (Adobe Camera Raw 5.4b) |
9.88 | -- | 9.30 | 7.76 |
| Panasonic DMC-GH1 (Camera JPEG iExposure=Standard) |
8.76 | -- | -- | 7.76 |
| Nikon D5000 (Camera JPEG), (Advanced D-Lighting=Low ) |
-- | -- | 9.28 | 7.75 |
| Canon Rebel T1i (Adobe Camera Raw 5.4b) |
11.2 | 10.2 | 9.16 | 7.73 |
| Canon EOS 40D (Adobe Camera Raw 4.2) |
11.2 | 10.1 | 9.26 | 7.72 |
| Canon Rebel XSi (Adobe Camera Raw 4.4.1) |
10.6 | 9.95 | 9.10 | 7.68 |
| Canon EOS 50D (Camera JPEG) (ALO STD by default) |
-- | -- | 8.90 | 7.68 |
| Nikon D700 (Camera JPEG) |
-- | -- | 9.05 | 7.67 |
| Canon 5D Mark II (Camera JPEG) (ALO STD) |
10.6 | 9.68 | 8.98 | 7.66 |
| Nikon D5000 (Camera JPEG), (Advanced D-Lighting=Off) |
-- | -- | 8.96 | 7.65 |
| Canon EOS-5D (Camera JPEG) |
10.2 | 9.68 | 8.82 | 7.65 |
| Olympus E-3 (Adobe Camera Raw 4.3) |
10.3 | 10.1 | 9.29 | 7.64 |
| Canon 5D Mark II (Camera JPEG) (ALO Off) |
-- | 9.67 | 8.96 | 7.62 |
| Nikon D60 (Camera JPEG) |
10.5 | 9.62 | 8.89 | 7.62 |
| Nikon D200 (Adobe Camera Raw 3) |
10.6 | 9.65 | 8.96 | 7.61 |
| Nikon D80 (Adobe Camera Raw 3.6) |
11.1 | 10.4 | 9.42 | 7.51 |
| 7.5 Stops | ||||
| Olympus E-500 (Adobe Camera Raw 3) |
10.7 | 9.97 | 8.90 | 7.46 |
| Olympus E-510 (Adobe Camera Raw 4.1) |
10.0 | 9.43 | 8.64 | 7.46 |
| Pentax K10D (Camera JPEG) |
-- | 9.49 | 8.88 | 7.44 |
| Nikon D300 (Camera JPEG) |
-- | -- | 8.70 | 7.44 |
| Olympus E-420 (Adobe Camera Raw 4.1.1) |
10.0 | 9.61 | 8.65 | 7.44 |
| Canon Rebel T1i (Camera JPEG) (ALO=STD by default) |
11.3 | 10.1 | 9.34 | 7.43 |
| Nikon D2Xs (Adobe Camera Raw 3.6) |
10.6 | 9.90 | 8.93 | 7.42 |
| Canon EOS 40D (Camera JPEG) |
10.6 | 9.52 | 8.78 | 7.42 |
| Nikon D3X (Camera JPEG) (Advanced D-Lighting=Off) |
-- | -- | -- | 7.37 |
| Nikon D50 (Camera JPEG) |
10.7 | 9.93 | 8.70 | 7.36 |
| Panasonic DMC-G1 (Adobe Camera Raw 5.2) |
10.7 | 9.78 | 8.70 | 7.32 |
| Sony A900 (Camera JPEG) (DRO off by default ) |
10.2 | 9.75 | 8.49 | 7.31 |
| Sony A200 (Camera JPEG) (DRO on by default) |
10.4 | 9.43 | 8.91 | 7.29 |
| Canon EOS 20D (Camera JPEG) |
10.3 | 9.66 | 8.85 | 7.29 |
| Canon EOS 30D (Camera JPEG) |
10.3 | 9.50 | 8.57 | 7.29 |
| Nikon D40 (Camera JPEG) |
10.4 | 9.80 | 8.89 | 7.28 |
| Sony A900 (Camera JPEG) (DRO on) |
10.1 | 9.76 | 8.47 | 7.26 |
| Canon Rebel XS (Camera JPEG) |
10.3 | 9.4 | 8.61 | 7.22 |
| Olympus E-520 (Adobe Camera Raw 4.5) |
11.0 | 9.46 | 8.70 | 7.20 |
| Sony A350 (Camera JPEG) (DRO on by default) |
10.3 | 9.55 | 8.85 | 7.19 |
| Panasonic DMC-GF1 (Adobe Camera Raw 5.5) |
10.2 | 9.62 | 8.62 | 7.16 |
| Nikon D80 (Camera JPEG) |
10.1 | 9.43 | 8.48 | 7.12 |
| Canon Digital Rebel XT (Camera JPEG) |
10.3 | 9.51 | 8.61 | 7.11 |
| Nikon D200 (Camera JPEG) |
-- | 9.07 | 8.36 | 7.11 |
| Panasonic DMC-G1 (Camera JPEG, iExposure = Low) |
-- | 9.29 | 8.50 | 7.09 |
| Panasonic DMC-G1 (Camera JPEG, iExposure = Standard) |
-- | 9.30 | 8.54 | 7.07 |
| Olympus E-300 (Camera JPEG) |
10.8 | 9.26 | 8.48 | 7.07 |
| Olympus E-410 (Adobe Camera Raw 4.1) |
10.2 | 9.40 | 8.24 | 7.05 |
| Olympus E-500 (Camera JPEG) |
10.0 | 9.14 | 8.16 | 7.05 |
| Canon Digital Rebel XTi (Camera JPEG) |
9.83 | 9.10 | 8.27 | 7.04 |
| Canon EOS-1Ds Mark II (Camera JPEG) |
10.3 | 9.38 | 8.60 | 7.04 |
| Panasonic DMC-G1 (Camera JPEG, iExposure = High) |
10.3 | 9.23 | 8.54 | 7.04 |
| Panasonic DMC-G1 (Camera JPEG, iExposure = Off) |
-- | 9.33 | 8.52 | 7.03 |
| Pentax K200D (Camera JPEG) |
-- | 9.50 | 8.30 | 7.01 |
| 7.0 Stops | ||||
| Panasonic DMC-GF1 (Camera JPEG, iExposure = Off) |
-- | 9.33 | 8.44 | 6.99 |
| Canon Digital Rebel (Camera JPEG) |
10.1 | 9.11 | 8.47 | 6.97 |
| Nikon D2Xs (Camera JPEG) |
9.82 | 8.98 | 8.23 | 6.97 |
| Panasonic DMC-L10 (Adobe Camera Raw 4.2) |
10.4 | 9.34 | 8.48 | 6.91 |
| Sigma DP1 (Camera JPEG) |
-- | 8.95 | 8.13 | 6.91 |
| Pentax *istDs (Camera JPEG) |
10.2 | 10.0 | 8.87 | 6.90 |
| Sony A100 (Camera JPEG) |
10.2 | 9.24 | 8.39 | 6.89 |
| Pentax K100D (Camera JPEG) |
10.3 | 9.30 | 8.39 | 6.73 |
| Pentax K20D (Camera JPEG) |
10.2 | 9.21 | 8.09 | 6.66 |
| 6.5 Stops | ||||
| Nikon D2x (Camera JPEG) |
-- | 8.93 | 7.75 | 6.43 |
| Olympus E-3 (Camera JPEG) |
9.32 | 9.06 | 8.50 | 6.42 |
| Panasonic DMC-L10 (Camera JPEG) |
-- | 8.94 | 8.00 | 6.38 |
| Olympus E-420 (Camera JPEG) |
9.18 | 8.82 | 7.93 | 6.37 |
| 6.0 Stops | ||||
| Olympus E-410 (Camera JPEG) |
-- | -- | 7.60 | 5.99 |
| Nikon D70s (Camera JPEG) |
9.84 | 8.69 | 7.46 | 5.85 |
| Nikon D70 (Camera JPEG) |
9.81 | 8.76 | 7.58 | 5.84 |
| Olympus E-520 (Camera JPEG) |
9.32 | 8.68 | 7.74 | 5.74 |
| Olympus E-P1 (Camera JPEG, ISO 200, Gradation = Normal) |
-- | 8.85 | 7.74 | 5.47 |
The results shown in the table are interesting. One of the first things that struck me when I (Dave) initially looked at test data for a wide range of DSLRs, was that here again, purely analytical measurements don't necessarily correlate all that well with actual photographic experience. There's no question that the Fuji S3 Pro deserved its place atop the list, as its unique "SR" technology did indeed deliver a very obvious improvement in tonal range in the highlight portion of the tonal scale relative to competing models of its day. (Amazing that it's now surpassed by even consumer-level models using today's technology.) I was also surprised to see the analytical results place the original Olympus E-300 as highly as they did, given that our sense of that camera's images was that they were in fact noisier than those of many other DSLRs that we looked at. In the other direction, I was quite surprised to see the Nikon D2x place as low on the listings as it did, given that we found that camera's shadow detail to be little short of amazing.
One thing that's going on here though, is that we tested each camera at its base ISO setting, which should produce best-case noise levels. This is in fact what many photographers will be most interested in, but it does perhaps place some of the Nikons (like the D40) at a disadvantage, as their lowest ISO setting is 200, as compared to the ISO 100 settings available on most other models.
When it comes to the Panasonic GF1, the in-camera processing appears to be delivering pretty close to best its Micro Four Thirds sensor has to offer in terms of dynamic range.
Panasonic GF1 Resolution Chart Test Results
The chart above shows consolidated results from spatial frequency response measurements in both the horizontal and vertical axes for an in-camera JPEG. (We used our very sharp Olympus 50mm f/2 macro lens for this test.) The "MTF 50" numbers tend to correlate best with visual perceptions of sharpness, so those are what we focus on here. The uncorrected resolution figures are 2,659 line widths per picture height in the horizontal direction (corresponding to the vertically-oriented edge), and 2,422 lines along the vertical axis (corresponding to the horizontally-oriented edge), for a combined average of 2,540 LW/PH. Correcting to a "standardized" sharpening with a one-pixel radius reduced resolution by quite a bit, resulting in a lower average of 1,711 LW/PH, somewhat low for a 12-megapixel SLR-like camera.
To see what's going on, refer to the plots below, which show the actual edge profiles for both horizontal and vertical edges, in both their original and corrected forms. Here, you can see that a high amount of in-camera sharpening is applied in the horizontal direction (oversharpened by 21.9 %, explaining why standardized sharpening reduced the MTF 50 numbers so much). The GF1's in-camera sharpening is not quite as aggressive in the vertical direction (16.5 % oversharpened), but still on the high side. You should thus turn the camera's sharpening down a little for optimal results when sharpening in-camera JPEGs post-exposure in Adobe Photoshop or other image editing software, or shot RAW for complete control of sharpening.
 Fujifilm GFX 50S Review
 Fujifilm X-T3 Review
 Olympus E-M5 III Review

Follow Imaging Resource