Pentax Q Image Quality
Color
Saturation & Hue Accuracy
Bright, vibrant colors, though below average hue accuracy.
 |
|||
| ISO 125 | ISO 200 | ISO 400 | ISO 800 |
| ISO 1600 | ISO 3200 | ISO 6400 | |
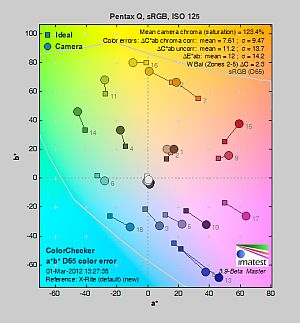
| In the diagram above, the squares show the original color, and the circles show the color that the camera captured. More saturated colors are located toward the periphery of the graph. Hue changes as you travel around the center. Thus, hue-accurate, highly saturated colors appear as lines radiating from the center. Mouse over the links to compare ISOs and click for larger versions. | |||
Saturation. The Pentax Q pushes strong blues and purples quite a bit, as well as bright reds and some greens. Most other colors are either accurate or only slightly oversaturated. Default saturation is 123.4% (23.4% oversaturated) at base ISO, which is notably higher-than-average, but signature Pentax. Saturation remains reasonably constant throughout the ISO range, which is good. You can always decrease saturation, or select a different picture mode to adjust color to your tastes. Most consumer digital cameras produce color that's more highly saturated (more intense) than what's found in the original subjects. This is simply because most people like their color a bit brighter than life.
Skin tones. Here, because default saturation is high, the Pentax Q produced Caucasian skin tones that had quite a bit of color, with lighter areas a bit too orange/yellow and darker skin tones more pink. Where oversaturation is most problematic is on Caucasian skin tones, as it's very easy for these "memory colors" to be seen as too bright, too pink, too yellow, etc.
Hue. The Pentax Q did push cyan toward blue and oranges significantly toward yellow, but other hues were about right. (The cyan to blue shift is very common among the digital cameras we test; we think it's a deliberate choice by camera engineers to produce better-looking sky colors.) The Delta-C color error after correction for saturation of 7.61 at base ISO is higher-than-average (lower numbers are better) compared to other CSCs or compact cameras. Hue is "what color" the color is.
Color Modes
The Pentax Q offers a large selection of Custom Image and Smart Effects modes, as well as the ability to tweak contrast, saturation, dynamic range, digital filters, and a host of other creative parameters (depending on the mode).
Custom Image Modes |
||||
 |
||||
Mouse over the links above to see the effect of the Custom Image Mode presets on our Still Life target. You can click on a link to load the full resolution image.
Smart Effects Modes |
|||
 |
|||
Mouse over the links above to see the effect of some of the Smart Effects presets on our Still Life target. Other effects not shown include Warm Fade, Tone Expansion, Bold Monochrome, Water Color and Vibrant Color Enhance. You can click on a link to load the full resolution image.
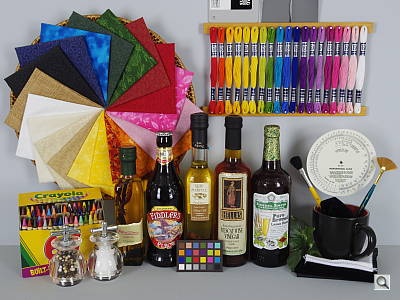
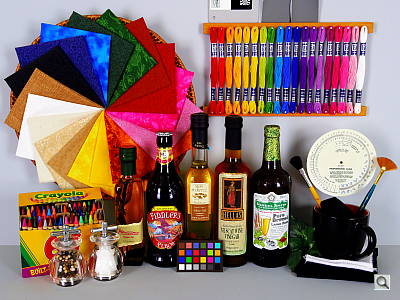
Saturation Adjustment
The Pentax Q lets you adjust the image saturation (as well as other parameters such as contrast, hue, high/low key and sharpness), in nine steps (-4 to +4). As can be seen below, the saturation adjustment works well, covers a useful range and doesn't strongly impact contrast. (Minor contrast tweaks are somewhat visible at the highest setting.)
| Saturation Adjustment Examples | ||
 |
 |
 |
| -4 | 0 | +4 |
The table above shows results with the default as well as the two extreme saturation settings. See the Test Shots page for the full range of settings. Click on any thumbnail above, then click again to see the full-sized image.
 |
 |
 |
Sensor
Exposure and White Balance
Indoors, incandescent lighting
Strong warm casts with both Auto modes, and cooler casts with Incandescent and Manual. Higher than average exposure compensation required.
 |
 |
Auto 1 White Balance +1.0 EV |
Auto 2 White Balance +1.0 EV |
 |
 |
Incandescent White Balance +1.0 EV |
Manual White Balance +1.0 EV |
Indoors, under normal incandescent lighting, color balance was quite warm with both of the Pentax Q's Auto white balance options. Results with the Incandescent setting were quite cool, while the Manual setting produced a slightly greenish tint overall. Still, Manual produced the most appealing color balance to the eye, despite the slight cast. The Pentax Q required more than the average amount of positive exposure compensation here, at +1.0 EV; the average needed among cameras we've tested for this shot is about +0.3 EV. (Our test lighting for this shot is a mixture of 60 and 100 watt household incandescent bulbs, a pretty yellow light source, but a very common one in typical home settings here in the U.S.)
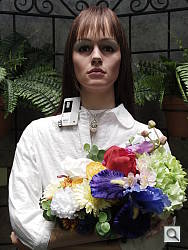
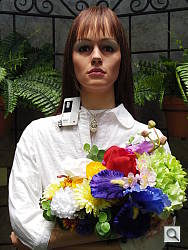
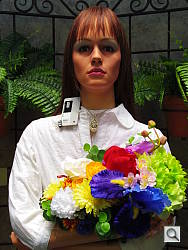
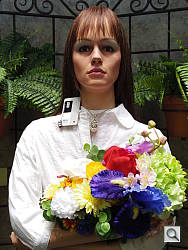
Outdoors, daylight
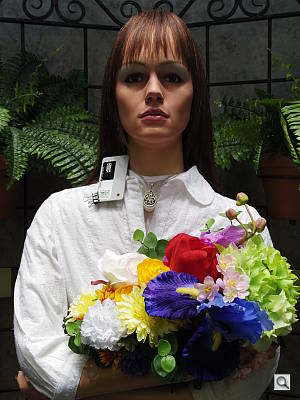
Bright, vibrant colors with pretty good exposure.
 |
 |
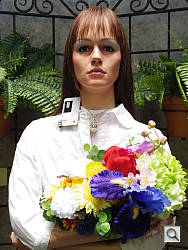
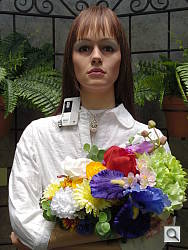
Manual White Balance, +0.7 EV |
Auto White Balance, Auto Exposure |
Outdoors, the Pentax Q performed fairly well, with good color and good exposure in the outdoor Far-field shot. Highlights are a little hot on the white columns, but a fair amount of detail remains present. The Pentax Q required an average amount of positive exposure compensation (+0.7 EV) to keep facial tones reasonably bright on the "Sunlit" Portrait test. Default contrast is quite high, so there are quite a few blown highlights in the shirt, pendant and flowers. Shadow detail was pretty good, though. Overall, pretty good results here for a camera with such a small sensor.
See full set of test images with explanations
See thumbnails of all test and gallery images
Resolution
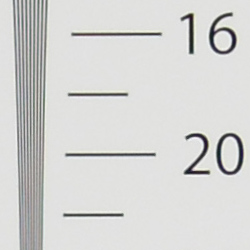
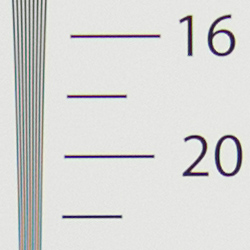
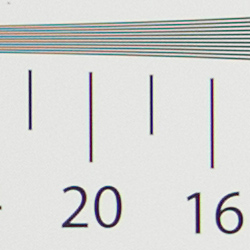
High resolution, ~ 1,900 to ~1,950 lines of strong detail in JPEGs, about the same from RAW.
 |
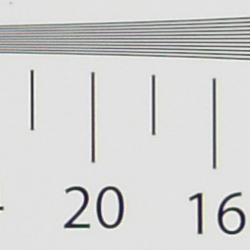 |
Strong detail to ~1,950 lines horizontal Camera JPEG |
Strong detail to ~1,900 lines vertical Camera JPEG |
 |
 |
Strong detail to ~1,950 lines horizontal ACR processed DNG |
Strong detail to ~1,900 lines vertical ACR processed DNG |
Camera JPEGs of our laboratory resolution chart revealed sharp, distinct line patterns down to about 1,950 lines per picture height horizontally and to about 1,900 lines vertically. Complete extinction of the pattern didn't occur until about 2,300 lines horizontally, and 2,500 lines vertically. RAW files converted with Adobe Camera Raw showed similar resolution, though color moiré was much more visible near resolution limits. Use these numbers to compare with other cameras of similar resolution, or use them to see just what higher resolution can mean in terms of potential detail.
See full set of test images with explanations
See thumbnails of all test and gallery images
Sharpness & Detail
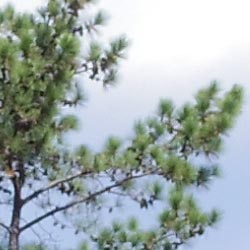
Somewhat soft images overall, though edge-enhancement artifacts on high-contrast subjects are visible. Moderate noise suppression visible in the shadows.
 |
 |
Fair definition of high-contrast elements, without strong edge enhancement artifacts. |
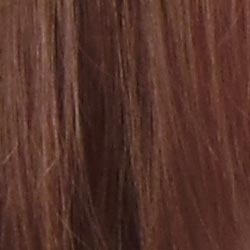
Subtle detail: Hair Noise suppression tends to blur detail in areas of subtle contrast. |
Sharpness. The Pentax Q's images are often on the soft side, with fine details like the pine needles in the above left crop smudged together by strong default noise reduction. Some edge enhancement artifacts such as sharpening halos can be seen around high contrast elements such as the larger branches and some pine cones, though not finer detail such as the pine needles themselves. The 01 Standard Prime 8.5mm f/1.9 lens is also contributing to some softness here, as our standard aperture for this shot is f/5.6 for cameras with small sensors, but this lens is noticeably sharper at f/2.8. Edge enhancement creates the illusion of sharpness by enhancing colors and tones right at the edge of a rapid transition in color or tone.
Detail. The crop above right shows moderate levels of noise suppression artifacts, and a light noise grain pattern even in the lighter areas of the model's hair, smudging individual strands together, and leaving only the highest contrast strands distinctly visible. Note that the Indoor Portrait images used for hair crops were shot at f/4, so lens softness due to diffraction is not as much of an issue here. Noise-suppression systems in digital cameras tend to flatten-out detail in areas of subtle contrast. The effects can often be seen in shots of human hair, where the individual strands are lost and an almost "watercolor" look appears.
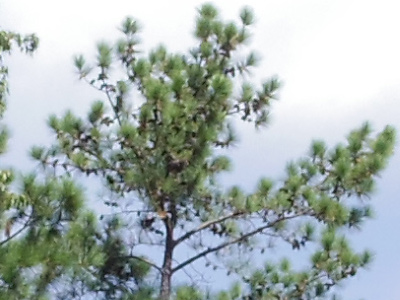
Since shooting our Q lab shots, Pentax has released firmware version 1.01, which is said to "improve the resolution when setting Fine Sharpness." Fine Sharpness is an alternative to the standard sharpening setting.
We reshot our "Pine" target to see if it made any difference (it was one of the few shots where the camera enabled Fine Sharpness -- we always leave sharpness at default settings), and indeed the new firmware made a difference. It's a little difficult to compare these shots because the lighting, sky, and even foliage are different, but if you look closely, you can see sharpening is stronger and noise reduction seems to be lower with the new firmware, leading to slightly better definition of fine detail, but also more visible sharpening artifacts and noise.
RAW vs In-Camera JPEGs
As noted above, the Pentax produces somewhat soft in-camera JPEGs. We were able to extract a little more detail by processing RAW files through Adobe Camera Raw, but not as much as we expected. Take a look below, to see what we mean:
In the table above, mousing over a link at the bottom will load the corresponding crop in the area above, and clicking on the link will load the full resolution image. The image on the left is an in-camera JPEG, while the one on the right was processed with Adobe Camera Raw 6.6, and then sharpened in Photoshop using very strong Unsharp Mask of 400% with radius 0.6. (The Pentax Q's RAW file are quite soft requiring stronger sharpening than most. We also noticed the camera appears to apply noise reduction to RAW files even at base ISO, which may explain some of the softness.)
As you can see, the Adobe Camera Raw conversion resulted in an image with slightly improved fine detail, though it's still on the soft side despite applying strong sharpening, and it does contain a bit more noise "grain" than the in-camera JPEG. On a more positive note, ACR was able to recover some of the lost highlights in the white clouds.
ISO & Noise Performance
Good detail to ISO 400, but very strong blurring from noise and noise suppression at higher settings.
|
Default High ISO Noise Reduction
|
 |
 |
 |
ISO 125 |
ISO 200 |
ISO 400 |
 |
 |
 |
ISO 800 |
ISO 1,600 |
ISO 3,200 |
 |
||
ISO 6,400 |
||
The Pentax Q's images are already a bit noisy and smudgy even at the lowest ISO setting of 125. Though detail is reasonable, noise grain is already apparent. However, detail remains relatively strong up to about ISO 400 compared to most digicams. By ISO 800, noise suppression starts to take over and fine detail gives way. As sensitivity increases, so does the amount of blurring and the size of visible noise grain. By ISOs 3,200 and 6,400, the majority of fine detail is lost. Chroma noise in the form of yellow and purple blotches also becomes more evident in darker areas at higher ISOs. Overall, these results show how the Pentax Q's tiny sensor can't really compete with the much larger sensors found in most other compact system cameras, though the Q does well against most compact digicams. As always, see the Print Quality section below for maximum recommended print sizes at each ISO.
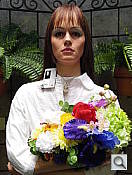
Extremes: Sunlit, dynamic range and low light tests
Good detail and dynamic range, though with high default contrast. Good low-light performance, helped by a fast (bright) lens.
 |
|
 |
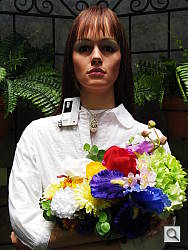
+0.3 EV |
+0.7 EV |
+1.0 EV |
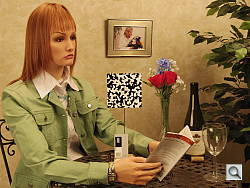
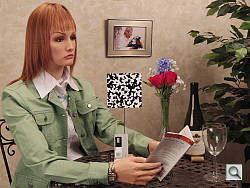
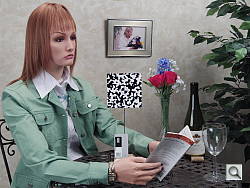
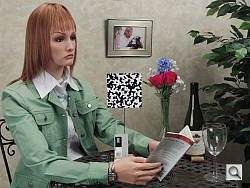
Sunlight. The Pentax Q struggled a bit with this difficult shot as do many cameras, mainly because of its high default contrast, though it performed quite well for a compact camera. At +0.3 EV, the mannequin's face looks slightly dim in areas, while +1.0 EV pushed highlights way too much on the shirt and face, so here we preferred the +0.7 EV exposure overall. As mentioned previously, most cameras we've tested require about +0.7 EV for this "Sunlit" Portrait shot, so the Pentax Q's exposure performance here was about average. We did however notice some inconsistencies in exposure, though: the same series using Auto white balance (the above used Manual white balance) produced a darker image at +0.7 EV than +0.3 EV, and the Contrast series at +0.3 EV is slightly dimmer than other "Sunlit" Portrait shots using the same exposure compensation. Variations in exposure like this aren't rare though, and can be due to a sticky aperture mechanism, but we can't be sure that was the cause here. Dynamic range was limited, as expected when high contrast is combined with a small sensor, producing quite a few clipped highlights, though shadow detail was actually pretty good. Compared to other small sensor cameras, though, the Pentax Q actually did quite well.
Because digital cameras are more like slide film than negative film (in that they tend to have a more limited tonal range), we test them in the harshest situations to see how they handle scenes with bright highlights and dark shadows, as well as what kind of sensitivity they have in low light. The shot above is designed to mimic the very harsh, contrasty effect of direct noonday sunlight, a very tough challenge for most digital cameras. (You can read details of this test here. In actual shooting conditions, be sure to use fill flash in situations like the one shown here; it's better to shoot in open shade whenever possible.)
Contrast Adjustment
The camera's contrast adjustment helped in handling the harsh lighting in our "Sunlit" Portrait and Far-field shots, though saturation also suffers.
|
Minimum Contrast
|
|
 |
 |
Contrast set to lowest, +0.3 EV |
Contrast set to lowest, Auto Exposure |
At its lowest contrast setting, the Pentax Q did a better job of preserving highlight and shadow detail, though skin tones appeared flat and colors less pumped.
| "Sunlit" Portrait Contrast Adjustment Examples | ||
|
 |
 |
| -4 | 0 | +4 |
The shots above show the results of the minimum, default and maximum contrast settings. See the Test Shots page for the full range of settings. As you can see with the lowest contrast setting, highlights are toned-down, while shadows and mid-tones are boosted, though some colors are a little muted.
Dynamic Range
A key parameter in a digital camera is its Dynamic Range, the range of brightness that can be faithfully recorded. At the upper end of the tonal scale, dynamic range is dictated by the point at which the RGB data "saturates" at values of 255, 255, 255. At the lower end of the tonal scale, dynamic range is determined by the point at which there ceases to be any useful difference between adjacent tonal steps. Note the use of the qualifier "useful" in there: While it's tempting to evaluate dynamic range as the maximum number of tonal steps that can be discerned at all, that measure of dynamic range has very little relevance to real-world photography. What we care about as photographers is how much detail we can pull out of the shadows before image noise becomes too objectionable. This, of course, is a very subjective matter, and will vary with the application and even the subject matter in question. (Noise will be much more visible in subjects with large areas of flat tints and subtle shading than it would in subjects with strong, highly contrasting surface texture.)
What makes most sense then, is to specify useful dynamic range in terms of the point at which image noise reaches some agreed-upon threshold. To this end, Imatest computes a number of different dynamic range measurements, based on a variety of image noise thresholds. The noise thresholds are specified in terms of f-stops of equivalent luminance variation in the final image file, and dynamic range is computed for noise thresholds of 1.0 (low image quality), 0.5 (medium image quality), 0.25 (medium-high image quality) and 0.1 (high image quality). For most photographers and most applications, the noise thresholds of 0.5 and 0.25 f-stops are probably the most relevant to the production of acceptable-quality finished images, but many noise-sensitive shooters will insist on the 0.1 f-stop limit for their most critical work. A full discussion of all the data Imatest produces is really beyond the scope of this review: Visit the Imatest website for details of what the program measures, how it performs its computations, and how to interpret its output.
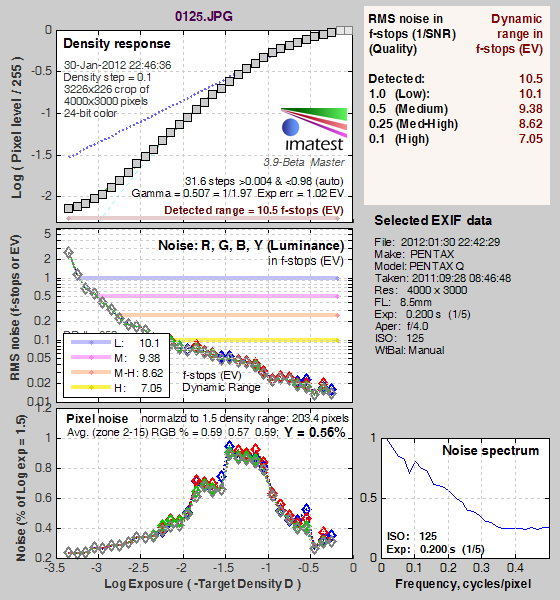 JPEG. The graph at right (click for a larger version) was generated using Imatest's dynamic range analysis for an in-camera Pentax Q JPEG file with a nominally-exposed density step target (Stouffer 4110). At default settings and base ISO, the graph shows 10.5 f-stops of total dynamic range, with 7.05 f-stops at the "High" quality level. The tone curve is nicely shaped, with fairly gradual roll-offs at both the highlight and shadow ends. These are surprisingly good results for a tiny sensor. Compared to the Pentax K-5 for instance, the Pentax Q scored just slightly lower at the "High" quality level (7.05 vs 7.22 f-stops), however total dynamic range was identical (10.5 f-stops). Note though that this measurement has a margin of error of about 1/3 f-stop, so differences of less than 0.33 can be ignored.
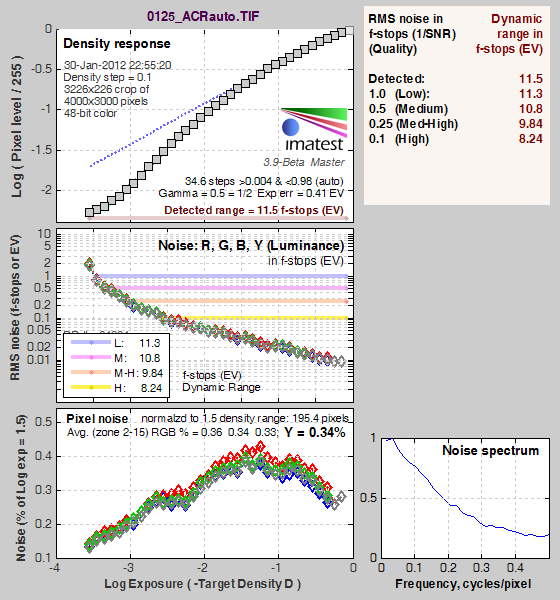 RAW. The graph at right is from the same Stouffer 4110 stepchart image captured as a RAW (.DNG) file, processed with Adobe Camera Raw The Pentax Q's RAW file also scored surprisingly well: an f-stop higher in total dynamic range compared to the JPEG (11.5 vs 10.5 f-stops), and the score at the highest quality level increased about 1.2 f-stops from 7.05 to 8.24 f-stops. These are better scores than most Micro Four Thirds compact system cameras with much larger sensors, though not as good as most APS-C sensors. The Pentax K-5 for instance managed a 10.2 f-stop score at the High Quality level, though total dynamic range was identical at 11.5 f-stops. It's worth noting here is that Adobe Camera Raw's default noise reduction settings reduced overall noise relative to the levels in the in-camera JPEG (compare the noise plots in the graphs), which tends to boost the dynamic range numbers for the High Quality threshold.
D-Range Settings
The Pentax Q offers separate Shadow Correction and Highlight Correction settings in its D-Range menu. Settings are On, Auto or Off for both. As the name implies, Shadow Correction works to raise shadow levels while attempting to keep highlights and midtones as they are, and likewise, Highlight Correction attempts to reduce highlights without darkening shadows and midtones. Both can be used simultaneously. See the images below to see their effect on our high contrast "Sunlit" Portrait test shot.
|
Outdoor Portrait Highlight and Shadow Correction
|
|
 |
|
 |
|
Mouse over the links to see how the various settings for D-Range affects our "Outdoor" Portrait shot. Click on a link to get to the full-res image. (The effect can be a little subtle in shots like those above, so we decided to use a mouse-over to better show how each setting compares to Off.)
As you can see, enabling Highlight Correction did tone down highlights, though On and Auto produced noticeably different results. The On setting reduced highlights, but also boosted shadows a bit, while the Auto setting was a little more aggressive at reducing highlights but also produced darker shadows. Shadow Correction worked well on shadows, this time with Auto being a little less aggressive at raising shadows than the On setting, though both settings clipped more highlights than Off.
HDR Capture
The Pentax Q has a High Dynamic Range (HDR) capture mode where the camera takes three images (- 3 EV underexposed, normal, and + 3 EV overexposed) in quick succession and combines them in-camera into one image. If performed properly, this method should result in much higher dynamic range, without the additional noise penalty that comes with boosting sensitivity when using the D-Range option. (In fact, it can reduce shadow noise by combining shadows from the overexposed shot.) There are three settings available: HDR 1, HDR 2, HDR Auto, as well as HDR Off.
As you can see from the above images, none of the HDR settings worked well with our "Sunlit" Portrait shot. The HDR 1 and 2 settings were much too strong for this scene yielding very unnatural looking images with strong halos and reduced saturation, while Auto dialed back the highlights too much, so the resulting image was quite dim. Perhaps some positive exposure compensation would have helped, but HDR modes rarely work well with portraits anyway.
Here's how they compare with our Far-field shot:
|
Far-field HDR Examples
|
|||
 |
|||
As you can see from the above images, HDR Auto worked fairly well on our Far-field test shot, but the 1 and 2 settings were again too much for this scene, resulting in unnatural looking images with strong halos and reduced saturation.
| Face Detection | |
 |
 |
| Off at 0 EV | On at 0 EV |
Face Detection
Like most Point & Shoot cameras these days (and some DSLRs in Live View mode), the Pentax Q has the ability to detect faces, and adjust exposure and focus accordingly. As you can see from the examples above, this feature did make a difference, but the image with face detection enabled is still quite dark overall. Full Auto mode probably would have done better.
Because digital cameras are more like slide film than negative film (in that they tend to have a more limited tonal range), we test them in the harshest situations to see how they handle scenes with bright highlights and dark shadows, as well as what kind of sensitivity they have in low light. The shot above is designed to mimic the very harsh, contrasty effect of direct noonday sunlight, a very tough challenge for most digital cameras. (You can read details of this test here.)
| 1 fc 11 lux |
1/2 fc 5.5 lux |
1/4 fc 2.7 lux |
1/8 fc 1.3 lux |
1/16 fc 0.67 lux |
1/16fc No NR |
|
|---|---|---|---|---|---|---|
| ISO 125 |
0.6 s f1.9 |
1.3 s f1.9 |
2.5 s f1.9 |
5 s f1.9 |
10 s f1.9 |
10 s f1.9 |
| ISO 200 |
0.4 s f1.9 |
0.8 s f1.9 |
1.6 s f1.9 |
3 s f1.9 |
6 s f1.9 |
6 s f1.9 |
| ISO 400 |
1/5 s f1.9 |
0.4 s f1.9 |
0.8 s f1.9 |
1.6 s f1.9 |
3 s f1.9 |
3 s f1.9 |
| ISO 800 |
1/10 s f1.9 |
1/5 s f1.9 |
0.4 s f1.9 |
0.8 s f1.9 |
1.6 s f1.9 |
1.6 s f1.9 |
| ISO 1600 |
1/20 s f1.9 |
1/10 s f1.9 |
1/5 s f1.9 |
0.4 s f1.9 |
0.8 s f1.9 |
0.8 s f1.9 |
| ISO 3200 |
1/40 s f1.9 |
1/20 s f1.9 |
1/10 s f1.9 |
1/5 s f1.9 |
0.4 s f1.9 |
0.4 s f1.9 |
| ISO 6400 |
1/80 s f1.9 |
1/40 s f1.9 |
1/20 s f1.9 |
1/10 s f1.9 |
1/5 s f1.9 |
1/5 s f1.9 |
Low Light. The Pentax Q performed well in low lighting, capturing bright exposures at our lowest light level even at the lowest ISO, helped by its bright f/1.9 kit lens. Noise is fairly well controlled up to around ISO 800, though ISO 1,600 isn't too bad. Noise is high at higher ISOs, to be expected from a small sensor. White balance is fairly neutral, with a slightly cool, blue/green cast that gets stronger at higher ISOs and lower light levels. Still, above average low-light performance compared to most compact cameras.
The camera's autofocus system was able to focus on the subject down to just under the 1/8 foot-candle light level unassisted, though to complete darkness with AF assist enabled. Pretty good performance for its class, helped again by the fast lens.
How bright is this? The one foot-candle light level that this test begins at roughly corresponds to the brightness of typical city street-lighting at night. Cameras performing well at that level should be able to snap good-looking photos of street-lit scenes.
NOTE: This low light test is conducted with a stationary subject, and the camera mounted on a sturdy tripod. Most digital cameras will fail miserably when faced with a moving subject in dim lighting. (For example, a child's ballet recital or a holiday pageant in a gymnasium.) Thanks to their phase-detect AF systems, digital SLRs tend to do much better than point & shoots, but you still shouldn't expect a quick autofocus lock with moving subjects. The Pentax Q uses contrast-detect autofocus, as is found in most point & shoot cameras, so its low-light focusing ability is less than that of most SLRs with phase-detect systems. (A useful trick is to just prop the camera on a convenient surface, and use its self-timer to release the shutter. This avoids any jiggling from your finger pressing the shutter button, and can work quite well when you don't have a tripod handy.)
Output Quality
Print Quality
Great 16x20-inch images from ISO 125-400; ISO 1,600 makes a good 8x10; ISO 6,400 shots are a little too soft at 4x6.
 Diffraction limiting affected the Pentax Q so dramatically that we had to reshoot our Still life shots at f/2.8 to get a sharper image, because the Q's original print quality assessment showed a disappointing 11x14-inch maximum print size for images shot at f/5.6. The new prints show considerably better performance.
ISO 125 shots look quite good in the detail department when printed as large as 16x20 inches. Unsurprisingly, reds are a little soft at this size, but we think most folks would accept the output as quite good.
ISO 200 images are also very good at 16x20 inches.
ISO 400 images are good at 13x19, but the red detail is a little softer, such that we prefer it printed at 11x14 inches.
ISO 800 shots look very good at 11x14.
ISO 1,600 shots are quite good at 8x10. Reds are soft, but that's not surprising for the sensor size. What's surprising is the good quality 8x10 at ISO 1,600!
ISO 3,200 images appear a little smudgy at 5x7; the color is there, but the detail seems too soft. Reduction to 4x6 results in a more normal-looking print.
ISO 6,400 images have the color, but not the detail again. The lack of noise is pretty remarkable, but it comes at the cost of detail. We'd call it usable, but not stellar.
Overall, though, the Pentax Q shot at f/2.8 performs very well, redeeming itself somewhat in our eyes from our first impressions. Diffraction limiting makes smaller apertures less useful for sharp images, but that's just a fact of digital photography, especially with small, high-resolution sensors.
Testing hundreds of digital cameras, we've found that you can only tell just so much about a camera's image quality by viewing its images on-screen. Ultimately, there's no substitute for printing a lot of images and examining them closely. For this reason, we now routinely print sample images from the cameras we test on our Canon Pro9000 Mark II studio printer, and the Canon Pixma MP610 here in the office. (See the Canon Pixma Pro9000 Mark II review for details on that model.)
 Fujifilm GFX 50S Review
 Fujifilm X-T3 Review
 Olympus E-M5 III Review

Follow Imaging Resource