Still Live and Multi/VFA Test Targets
By Dave Etchells
(Last updated: 10/29/2010)
| More about our testing |
| New Indoor/Outdoor Portrait Tests (5/23/2008) |
| New Daylight Simulator (5/23/2008) |
| "Sunlit" Portrait - What to look for (5/23/2008) |
| Indoor Portrait - What to look for (5/23/2008) |
| Still Life and Multi Targets (Updated 11/29/2010) |
| HMI Studio Lighting (5/22/2006) |
| Performance Timing (5/22/2006) |
| New Review Format (5/22/2006) |
As part of our initiative to provide fairly complete camera test data quickly, we added a new test target and modified an existing one in mid-2006. In April 2009, we further modified one of the targets, to accommodate a new higher-definition resolution target, and to increase the amount of information provided about color rendering, lens quality, some aspects of noise reduction, and de-mosaicing.
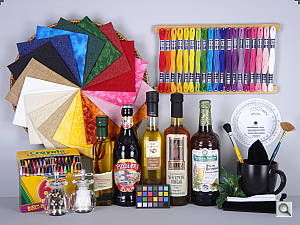 |
| Still Life target |
The photo above shows our Still Life target. We carefully assembled and arranged its contents to reveal an extraordinary amount of information about a camera's performance.
Here's what to look for in this target:
- Tone-on-tone detail & noise suppression: The cloth swatches in the pinwheel were chosen because they show a lot of tone-on-tone detail, across a broad range of colors. This is just the kind of detail that noise suppression processing tends to flatten out. If you look at the detail in these swatches as the ISO increases, you'll see just where different cameras start to lose subtle detail. -- The white and tan swatches, the red on red swatches and the dark swatches tend to be particularly revealing of this. The label of the vinegar bottle (second from the right) is another great place to look for lost detail from noise suppression, as the image of the person at the top of the label is actually a depiction of a mosaic. The dark colors in the background and in the figure's clothes contain detail that's very quickly lost when a camera's noise suppression system kicks in. Cameras with really high-quality, low-noise sensors that require little noise suppression will be able to hold onto the detail in these areas, but many others will show only a uniform swath of smudged color.
Another place where you'll quickly see the effects of over-aggressive noise suppression is in the white salt grains of the salt grinder in the lower left. Cameras are often more conservative about suppressing noise in highlight areas (because our eyes tend to see less of it there), but many cameras seem to have a hard time holding onto the subtle shadings that distinguish the salt grains from each other, particularly at higher ISO levels.
- Fine Detail: You'll find a lot of fine detail in the label of the beer bottle on the right, in its fine cursive text, but the other bottle labels hold a lot of fine detail as well. Fine text is often a good visual indicator of resolution, because our brains have an excellent idea of what the text should look like, so are very quick to notice even minor loss of detail.
For really fine detail, look to the circular scale/calculator on the right side of the scene. Some of the lines there are extremely fine indeed. Looking at results from many different cameras with this target, we found that camera noise-suppression systems often confuse the fine lines with image noise, and so flatten them out. There's also a nice range of fine text sizes in this chart as well, once again great visual cues for resolution and detail.
- Highlight Detail: Three elements in this scene show off (or show up) a camera's ability to hold onto highlight detail. As mentioned above, the salt grains (and reflections of the studio lights) in the salt mill are examples of fairly subtle highlight detail that cameras' anti-noise processing sometimes obliterate. The folded white cloth under the mug on the right side of the frame likewise shows a lot of white-on-white detail that is easy to lose, particularly if a camera's tone curve is too contrasty. As it turns out though, the most sensitive test of a camera's highlight abilities seems to be the hank of white embroidery thread in the upper right corner. These fibers are unusually bright and reflective, so its easy for a camera to blow out detail in them.
- Shadow Detail: Several elements of this subject are useful for evaluating shadow detail, particularly the black mug and the pieces of folded black velvet, both under and inside the mug. The bottoms of the beer bottles also provide some gradations of deep shadow, and the clump of peppers in the bottom of the pepper oil bottle had a fair bit of detail that's far down at the shadow end of the tone curve.
We were actually surprised when we constructed this scene just how dark the velvet and sides of the beer bottles come out on a camera. Even with the bright studio lights shining directly on it, the velvet in particular stays way, way down at the shadow end of the tone curve. With most cameras and on most monitors, the velvet will simply appear as an unrelieved swatch of black. To see whether it contains deep detail or not, in most cases you'll have to open the file in an image editor and boost the brightness dramatically, to bring the detail up into a visible range.
- Preservation of "Shape" in Strong Colors: As you approach the extremes of a camera's color gamut (its range of recordable colors), it becomes more and more difficult for the camera to show fine gradations of tone, because one or more of the RGB color channels are close to saturation. It's not uncommon to see a brightly colored piece of clothing or a vibrant flower appear in digicam photos as just a blob of color, because the camera ran up against the limits of its color gamut. The brightly colored embroidery threads in the upper right portion of the Still Life target are good examples of situations where this might happen. Pay particular attention to the bright red and dark blue colors here, as these are both colors near the edge of the typical sRGB color gamut.
- Color accuracy and white balance: It's pretty small in there, but we've included a mini MacBeth chart, which displays very carefully controlled color swatches. Our VFA / Multi Target (see below) sports a full-sized MacBeth chart, but the one here serves as a good check of color balance and rendition, and is also useful for checking white balance on this particular shot.
- Image noise and detail vs ISO: As mentioned above, this target contains many elements useful for evaluating detail loss to anti-noise processing. We'll therefore always shoot a full set of test images of this target across each camera's ISO range, for every camera we test.
A note about exposure
We sometimes get reader emails asking about exposure of this target with various cameras, because the images look either brighter or darker than the reader thinks they should, or because the combination of exposure time and aperture is different than that used for some other camera we've tested. Herewith are the details of how we expose this shot:
The exposure for this subject is set to produce RGB intensity values of ~122 per channel in the midtone grey swatch of the MacBeth chart.
In sRGB color space, the RGB value of the midtone grey on the MacBeth target should be about 122 for each channel, out of a total range of 0-255. (The midtone grey swatch on the MacBeth target is the one adjacent to the yellow patch.) Accordingly, we set the exposure in our test shots so the RGB values of this swatch end up at 122 +/- 5 units.
It turns out that the 1/3-EV exposure adjustment found in most digital cameras doesn't give fine enough control to hit the brightness level with the accuracy we feel necessary, so we adjust the light level slightly up or down by a fraction of an f-stop, to get the exposure level where we want it with each camera tested. We do this by moving the studio lights slightly toward or away from the subject, while keeping the angles between the lights and subject the same.
Some readers have suggested that we should hold the lighting absolutely constant, use the same shutter speed and aperture for all cameras at a given ISO setting, and let the images fall where they may. In our experience, though, this would result in greater variation in the appearance of the images, making it harder to judge cameras against each other. Minor inaccuracies in ISO sensitivity, lens aperture, and even shutter speed can combine to produce quite visible exposure differences.
In practice, you don't expose your shots based on what absolute measurements of light level and perfectly calibrated aperture and shutter speed settings would dictate anyway: You expose to produce images that look "properly exposed," however you may happen to define that. If the default exposure with a given camera looks a little light or dark, you adjust the exposure to compensate. Exposing for the same midtone RGB values, thus mirrors typical usage, and minor variations in aperture, shutter speed and actual sensitivity are compensated for in the process.
It's important to note, though, that precisely setting the midtone exposure doesn't necessarily guarantee that images from different cameras will look the same overall. Even with the midtone point fixed, differences in camera tone curves can result in other parts of the image looking brighter or darker. Higher color saturation can also produce a "brighter" looking photo, even if luminance levels are the same.
Our convention is to shoot these images with each camera's picture style (known by different names among different manufacturers; basically the presets for contrast/saturation/color mapping) set to the default, since that's what the vast majority of users will do. Default contrast, saturation and color mapping can vary a fair bit from manufacturer to manufacturer, so the images from some cameras may thus look brighter or duller than those from others. Of course, this is the whole point of showing test photos: The aim isn't to make different cameras' output look like each other, but rather to show what the captured photos do look like, with well-controlled shooting conditions.
One example of this is recent (2010) Pentax SLRs, which default to a picture style of "Bright." The Pentax Bright setting produces higher contrast and saturation than do the default settings of many competing models. On the other hand, Pentax's "Natural" setting produces lower saturation than the defaults of many others, so dropping back to Natural wouldn't necessarily make the images any more comparable to others. Bottom line, there simply are going to be differences in how cameras render the scene, so shooting with defaults and exposing consistently is the best approach.
Early on, we exposed this shot more the way many pros shoot, setting the exposure level for the highlights, to preserve highlight detail (as was the practice with slide film, in the "old days"). We found, though, that this resulted in the images from some cameras looking noticeably brighter or darker than most others. The problem was the aforementioned differences in tonal characteristics: If a camera had a more contrasty tone curve, holding the highlights (the white swatch of the MacBeth chart) at the same level would push the rest of the image darker. A less-contrasty tone curve would result in an image that looked lighter overall.
While exposing for highlight values may be a smart approach for pros, we decided that our mostly-amateur readers will typically expose more for the overall look of the image, so setting exposure in our test shots based on the MacBeth midtone swatch made better sense. You may thus find some older shots of this target with midtone values slightly lower or higher than our current standard. There's unfortunately no practical way to go back and reshoot earlier images that may differ slightly from ones shot to the current standard, but most models will look very similar. Going forward, though, anything shot from mid-2008 onward should match the current standard quite closely.
Current Viewfinder Accuracy/Multi-Target
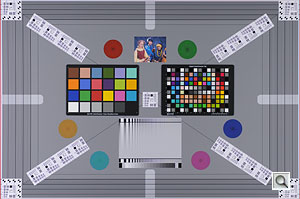 |
| Current VFA/"Multi" target |
As its name suggests, our current Viewfinder Accuracy/Multi-Target contains elements useful for evaluating a number of different aspects of camera performance. First put into service in April of 2009, it's an outgrowth of our original Viewfinder Accuracy target, designed to reveal more about lens performance and color handling, as well as viewfinder accuracy. Here's a description of its various elements and what to look for.
Framing marks: This chart evolved from the earlier Viewfinder Accuracy chart, so one of its major uses is to measure viewfinder accuracy. (See notes in the Viewfinder Accuracy section, at the bottom of this section, for more information on this.)
USAF resolution targets: An important use of this target is in evaluating lens quality, looking how well sharpness holds up as you move from the center to the corners of the frame. The little "USAF" resolution targets arranged at the center, in the corners, and along the diagonals are very useful for making fine judgements about blur, flare and aberrations in the image. We generally show crops of a USAF chip from a corner of the target and from the center, to show how lenses hold sharpness at wide and telephoto focal lengths.
Alignment "bull's-eyes:" We find these graphics from the graphic arts world (used to align sheets of film in the old film-based prepress days) very useful for seeing chromatic aberration in lenses. The bold black/white elements are good for seeing the colored fringes caused by CA in the corners of the frame.
MacBeth ColorChecker Chart: This is about as common a color standard as you can get these days, very widely available for only mildly exorbitant cost, and quite well controlled in its production. It thus serves as a good basis of comparison between cameras and between test setups. Imatest also understands the MacBeth colors very well, and uses them to produce its color accuracy map that we feature in all our reviews.
MacBeth ColorChecker SG Chart: The ColorChecker SG chart provides a wider range of colors, to give a more detailed map of a camera's color handling. We haven't begun using this chart in the color-accuracy graphs we routinely offer, but expect to do so at some point in the future. In the meantime, we sometimes refer to this chart internally, to get a more complete idea of what a camera's color map looks like.
Log C/F Target: The progressive resolution pattern located just below the center of the target is a Log C/F (logarithmic contrast vs spatial frequency) chart. Digital camera noise reduction routines work by looking at levels of local contrast, flattening-out detail at progressively lower spatial frequencies as the local contrast decreases. (This is very commonly seen in human hair, grass, foliage, and other subjects with subtly-contrasting fine detail.) This chart lets the Imatest image-analysis program evaluate just how a camera makes the tradeoff between contrast, detail, and image noise.
Color Starbursts: The six circular starburst elements arranged around the target are intended to reveal de-mosaicing artifacts and color-dependent resolution issues. The six starbursts provide examples of each combination of RGB colors intersecting each other. (That is, red, green, and blue against black, plus red against green, green against blue, and blue against red.) Given that the most common sensor RGB color filter pattern (the so-called Bayer) pattern has twice as many green pixels as red or blue, you'll generally see that the green/black starburst shows the best resolution, while the blue/red one shows the worst. The effects of different sensor geometries and color filter array patterns will be revealed here.
Musicians Image: Synthetic test patterns only tell you so much. While we have a lot of pictorial images in our other test targets, we thought it would be useful to include a small "natural" image here as well.
Using the VFA/Multi target for viewfinder accuracy measurements
Viewfinder accuracy is an important parameter, especially for shots where framing is critical. Traditionally, optical viewfinders on most digicams have matched the (poor) accuracy of those on film cameras, showing only about 85% of the actual final frame area. It's likely that this is a deliberate design choice by the camera engineers, to help avoid users accidentally cutting off the heads of their subjects. We disagree with this approach, or at least feel that it should be mitigated a bit, perhaps by increasing the accuracy to 90 to 95%. In recent years, accuracy has generally improved somewhat, but we'd still like to see it improved further. The viewfinders in typical SLRs are more accurate, with most consumer models running about 95%, but again, we'd like to see a better number. (Making an SLR viewfinder match the final sensor image 100% requires very close tolerances, so the expense can only be justified in higher-end professional models. Still, we'd like to see numbers more in the range of 97-98% for consumer models, rather than the 95% that's typical. )
Unlike the optical viewfinders, the LCD viewfinders on most digital cameras tend to be quite accurate. There are exceptions though, so this test is still important.
Things to look for on this test chart are:
- Optical/Electronic viewfinder accuracy: When we shoot this target in the studio, we line things up so the corners of the bright red outline on the target just touch the corners of the viewfinder frame. The resulting photo then very directly shows how accurate the viewfinder is. The fine black lines mark progressive increments of ~1% of increased or decreased frame area. The bold black lines mark 5% increments. The lines let you get an approximate idea of frame accuracy visually, but we measure the actual pixel dimensions to derive the accuracy numbers we report in our reviews.
- LCD monitor accuracy: This is the same test, but framed with the LCD monitor instead of the optical viewfinder. As mentioned above, LCD monitors are usually more accurate than optical viewfinders, especially in point & shoot digicams.
Important note: We use this chart both for viewfinder accuracy measurements, and for evaluating lens sharpness and distortion in the corners of the frame. When we shoot for the latter purpose, we align the image so the area within the red rectangle is precisely framed, so the USAF resolution chips and alignment targets will be in the corners of the frame. This provides a good reference for comparing basic lens performance, but it's important to note that such shots won't show inaccuracies in viewfinder framing. Here's our naming convention for these shots; shots containing the following strings are to be interpreted as described:
- VFAWL, VFATL - Viewfinder accuracy of the LCD display, with the lens at wide angle and telephoto settings, respectively
- VFAWO, VFATO - Viewfinder accuracy of the optical viewfinder display, with the lens at wide and tele settings, respectively
- VFAO, VFAL - On SLRs, the optical viewfinder accuracy doesn't change noticeably with the focal length, so we just shoot a single image with a low distortion prime lens for optical or LCD (the latter only if the SLR has a Live View mode)
- VFAWB, VFATB - shots for evaluating lens characteristics, framed to put the corners of the target in the corners of the image, regardless of viewfinder accuracy.
Older, Interim "Multi" Target
As noted above, the current "VFA/Multi" target has been in use from April 2009 forward. Back in 2006, we created an interim "Multi" target by adding some elements to the standard ISO-12233 resolution target, to let us cover more bases with a single image. We'd intended to replace it in fairly short order with the combined VFA/Multi target described above, but the constant press of higher-priority items and over-scarce human resources meant that the new Multi target with its elements for lens evaluation didn't come along until 2009. Here's a description of the contents of the interim Multi target:
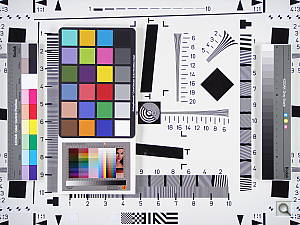 |
| Older, Interim "Multi" target |
The interim "Multi" target above will look familiar to anyone who's read any of our reviews over the last eight years, as it's just a number of additional elements tacked onto the standard ISO-12233 test target. This was actually something of a transitional target, as more elements were added to come up with the current VFA/Multi target described above, at which time an updated (higher-resolution) ISO-12233 chart was returned to duty for resolution tests.
The interim Multi target was just an ISO-12233 res chart with several other elements attached to it, covering portions of the target we don't generally use in our reviews. The added elements largely mirror ones that were present in our old "DaveBox" test target, which we've now semi-retired. Here's some of what you'll find in this target:
Res chart elements: In placing the new elements on the ISO target, we were careful to leave the highest-frequency hyperbolic resolution wedges (the sets of fine lines that fan out vertically and horizontally), since these are what most people look at on the ISO chart to judge camera resolution from. There are also enough of the slanted black parallelograms available to use them to measure a camera's Spatial Frequency Response characteristics with Imatest.
Gray Scale: While reflective gray scales don't cover the full dynamic range of higher-end cameras, advanced readers may be interested in using the gray scale here to evaluate noise performance vs brightness level, and/or examine the shape of a camera's tone curve.
MacBeth Chart: This is about as common a color standard as you can get these days, very widely available for only mildly-exorbitant cost, and quite well controlled in its production. It thus serves as a good basis of comparison between cameras and between test setups. Imatest also understands the MacBeth colors very well, and uses them to produce its color accuracy map that we feature in all our reviews.
Kodak Color Separation Target: We include this for reference because it's used by other reviewers out there, but caution our readers that it really isn't well-suited for use as an absolute color standard. As its name suggests, its actual intended purpose is as an aid in setting exposure levels for old-style film-based color separation, using panchromatic graphic arts film, RGB filters, and halftone screens. It's ideal for that use, but the colors aren't well-controlled enough and are too subject to fading for it to be usable as a true reference standard for color accuracy.
Kodak Q60 target: This is another target that's perhaps not well enough controlled for quantitative measurements between cameras, but one that does have several useful characteristics nonetheless. For instance, it provides a good reference for the handling of various colors representative of common skin tones (the tan and brown patches along its right side), as well as of lighter, less-saturated tints of both additive and subtractive primaries (red, green, blue, cyan, magenta, and yellow). The MacBeth chart's colors lean heavily toward highly saturated values, and there are no pastel tones present at all. In the past, we've found that cameras with contrasty tone curves sometimes have trouble with the pastel tones in the Q60 target, making it a valuable reference that we'll continue to include.