When it comes to digital camera image quality, much of what separates one camera from another ultimately comes down to how well the sensor, signal amplification, and readout circuitry do their jobs. Clever post-processing can do a lot to reduce the impact of image noise or poor color filtration. We've seen time and again that good third-party RAW converters can extract more detail, reduce noise more effectively, and render color more accurately than can the cameras' own internal processors. Ultimately, though, given free choice from among the myriad RAW converters available on the market, the quality of images one can extract from any given camera will depend on the quality of the data in the RAW file.
The Problem: Sensor performance buried behind demosaicing and JPEG processing
In our testing of digital cameras, I've long been frustrated by our inability to properly measure image quality based on the sensor's actual output. If we work from JPEG images, we're seeing the image only after conversion by the camera's internal processor, subjecting it to all manner of noise reduction and other processing.
We can bypass the effects of the camera's processing by using a RAW converter to extract the data from the RAW file directly, but this then leaves us subject to the vagaries of the particular RAW converter used: Would a better RAW converter have yielded better output? It's pretty clear that certain RAW converters work better with some manufacturer's cameras than others, so how can we arrive at anything like a standard?
The solution has always seemed to be to analyze the data in the RAW files directly, before any de-mosaicing is performed. De-mosaicing is the process of converting the array of separate red, green, and blue pixels into a full-color image, with full RGB data available at each pixel location. There are a wide variety of methods for doing this. The chosen method can have a significant impact on the quality of the resulting data - both in terms of the subject detail that's extracted, and how noise in the original sensor data translates into noise in the final RGB data.
The problem has been a lack of good analytical tools for looking at data in RAW files directly. The command-line tool dcraw lets you extract raw data into individual color planes, but by itself offers no analysis capability. Norman Koren's excellent Imatest also now supports RAW file formats. Our initial attempts at using it early last summer weren't successful, although program improvements since then may have eliminated the difficulties we experienced. Imatest doesn't - at least as yet - provide for direct measurements of native sensor ISO values, which are critical for the sort of work we want to do as we'll see in the next paragraph.
It also turns out that a good bit of work is required to really get to the bottom of image quality, and to do so on a completely fair basis across all camera platforms and models. Our time is limited, and adding even further to the labor burden of our tests is something we're hoping to avoid.
The importance of measuring the ISO
When looking at image noise from cameras, it's obviously important to consider it as a function of ISO sensitivity. Sensor noise will always increase as ISO is raised, so to be sure you're comparing apples to apples, you need to normalize the noise data vs the actual ISO the camera is shooting at.
Wait a minute; "actual" ISO? What's that mean? Don't the cameras just shoot at the ISO you select in their menus?
As it turns out, the short answer is no. Many older SLRs did in fact shoot at their indicated ISO levels, but manufacturers have recently begun to "cheat" a little, by running their cameras' sensors at ISO levels a little lower than those shown on their control dials or in their menus. This has the effect of distorting the results of noise tests, making their cameras look better against the competition - except it turns out in many cases that the competition has been doing the same, so the issue may be more one of comparing current cameras against older models. Whatever the case, since noise increases with ISO, running a camera at a lower ISO value than stated will result in its underlying sensor noise levels being lower than those of a camera operating at the stated ISO value.
This of course leads us to the question of how one defines ISO for a digital camera. The standard for the native or inherent ISO of a sensor relates to the amount of light it takes to completely fill its pixels with charge. At first glance, this sounds like it should be easy to measure: just see how much light it takes for the data in the RAW file to hit its maximum value. If it's a system with a 12-bit A/D converter, this would mean looking for the RAW data to reach a value of 4,095 (212 - 1). It turns out it's not that easy though, because system designers invariably leave a little headroom to avoid losing data if minor component variations make one sensor's maximum output level a little higher than others for the same camera model.
To determine a sensor's native ISO level, then, you need to look at sensor output for a range of exposure levels close to the saturation point. As you increase the exposure level, you'll find that the resulting values in the RAW files will stop increasing beyond a certain point. That's the saturation level of the sensor, and the amount of light falling on it at that point will tell you the native ISO.
Once you know the native ISO of a sensor, higher ISO values are quite simply calculated as ratios from the native sensitivity level. If a sensor had a true native ISO level of 100, then a true ISO level of 200 would be reached when its pixels were being half-filled with charge, an ISO level of 400 would be when they're 1/4 full, and so on.
If this sounds like a fair bit of work, it is: You need a set of carefully calibrated target, a carefully calibrated and regulated light source, and a good bit of patience - or good automation - for sorting through the data. Without accurate as-shot ISO data though, truly fair and unbiased image noise comparisons with other cameras are impossible.
Color Sensitivity: Even less information available
Image noise and ISO capability are obviously only part of the sensor-quality story, though. What about a camera's ability to capture color? Note that when we're talking about raw sensor data, we're not talking about color accuracy, but rather the ability of a camera's sensor and signal-processing chain to measure and discriminate color. The accuracy of the camera's color will be almost entirely a function of the quality of the color management and calibration used in the RAW converter, and so can and will change if different RAW converters are used.
What we ultimately care about in the data coming from a digital camera's sensor and signal processing chain are how wide a range of colors it can recognize (the gamut of the sensor), and how finely it can discriminate between similar colors (its color "resolution," for lack of a better term). The ideal would be a camera that could recognize the full range of human-perceivable color and discriminate between colors as well as the most sensitive human eye.
Color sensitivity is a very complex function of the quality of the RGB filters used on the sensor's surface, the sensor's own light and spectral sensitivity, the digitization depth (number of bits in the A/D converter), and the noise levels of the sensor and image-processing chain.
To date, there haven't been any good tools available for looking at color sensitivity. Color-management tools will map a camera's color gamut, and rendering errors within the gamut it covers, but offer no help when it comes to determining how finely a camera can discriminate between colors.
DxOMark: A solution is at hand!
I had actually been planning to write an article like this for some months now, in the hopes that it would stimulate the development of software for analyzing RAW files that would encompass all the issues listed above. When I was at Photokina back in late September, though, an NDA briefing with top management and image scientists from DxO Labs revealed that a full solution was about to become public. The best part was the price: free.
As part of the testing needed to create their excellent DxO Optics Pro software, DxO Labs collects extraordinarily in-depth data on a wide range of digital SLR cameras. It occurred to them that - with a little additional analysis, graphing, and some effort by a web designer - the data they were collecting anyway could be made available to the photo community as a whole. The result is the new DxOMark website, just unveiled today (November 17, 2008).
It will take a little while for us to integrate the information on the DxOMark site into our own reviews of digital SLRs, as we're considerably backlogged at the moment. The data that's to be found on DxOMark.com is pretty extraordinary, though, as it finally provides a basis for objectively, dispassionately, and scientifically evaluating the fundamental image quality produced by various DSLRs in their RAW files.
DxOMark Overview
Let's take a quick look at some of the data in the DxOMark database, and see what it tells us about several recent DSLRs.
The screen shot above shows a summary screen, comparing the Canon 50D, Nikon D90, and Olympus E3. (One suggestion to DxO: It'd be really nice to be able to compare more than three cameras, perhaps four or five would be nice. Particularly as reviewers, we'll frequently want to compare more than 3 cameras with each other, in discussing the pros and cons of each.) The DxOMark Sensor score is a composite value that represents an aggregate of the other three. More detail on all these displays and measurements is available on DxOMark.com. Here's a link for more info on the DxOMark scoring and the bargraph displays shown above.
Let's look at some of the individual measurements, starting with ISO sensitivity:
Above is an example of the ISO "cheating" we mentioned earlier. Consistent with other recent cameras from both manufacturers, the Canon 50D and Nikon D90 both run their sensors slightly below their actual ISO levels for all settings above ISO 100. By contrast, the Olympus E3 holds pretty true to the actual ISO levels.
Next, we can look at the SNR (Signal to Noise Ratio), a measure of the noise levels from the sensor. It's interesting to note here that the Olympus E3 and Canon EOS 50D sensors actually show almost identical SNR values, except at very high ISO levels. NOTE though, that we're talking about SNR levels in the RAW files, rather than after the images have been processed through either the camera's own RAW-JPEG converter or that of a RAW conversion software package. Canon's excellent noise-suppression technology is evident in the 50D's JPEG output. It's also important to note that these are the "screen" values; that is, the SNR values corresponding to images from both cameras being viewed on-screen, pixel-for-pixel.
An important distinguishing factor between the 50D and E3 is the resolution of the two cameras: The 50D's images have almost half again as many pixels as those from the E3. This comes into play when you print the camera's images: If a higher-resolution and lower-resolution camera have the same noise levels, when you print their images at the same size the noise from the higher-resolution will be less visually apparent. Recognizing this, DxOMark also calculates a number of its measures based on the appearance of images printed at a standard 8x12 inch output size. Let's see what that does to the relative SNR ratings of these three cameras:
The graph above shows the SNR when the cameras' resolution is taken into account, considering how the images would look if they were all printed at the same physical size. Under those conditions, the 50D's performance improves above that of the E3, and is now approaching that of the D90.
Above is a comparison of each camera's dynamic range. While the E3's sensor held its own on the SNR measurements, it loses ground in dynamic range. The D90 remains on top.
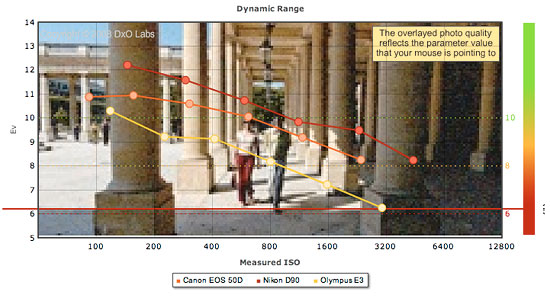
Sometimes, it can be hard to relate abstract numbers for things like dynamic range to actual image appearance. On the DxOMark site, if you mouse over the vertical scale to the right of many of the graphs, an image will appear under the graph, and a horizontal line appears to mark the quality level corresponding to your cursor position. As you move the mouse up and down the vertical scale, the quality of the underlaid image changes to match the quality level beneath your mouse pointer. In this case, you can see the dynamic range is being limited by noise in the shadows; moving the pointer higher on the quality scale reveals an increasingly clean image.
Next, we have a plot of screen-referenced tonal range. The graph is underlaid with an example of an image with a tonal range of about 5.5 bits.
Finally, above is a plot showing color sensitivity - this time print-referenced. As chroma noise increases at higher ISOs, the cameras' ability to discriminate colors in the subject decreases - in some cameras more rapidly than others. The Nikon D90 again comes out on top in this test.
Which model? Upgrade or not? - Using DxOMark
The foregoing is just a quick look at the types of information provided by DxOMark. The real fun comes in using it to actively evaluate cameras you may be considering buying, to see if there's enough improvement in image quality to justify an upgrade. Of course, there are many other reasons you might want to upgrade a camera, besides image quality.
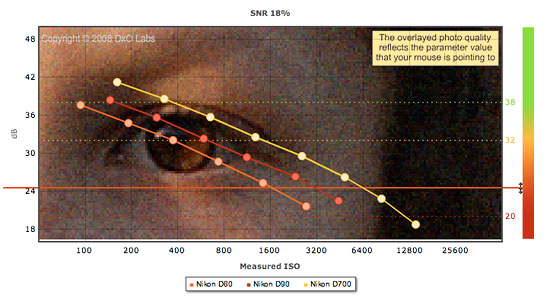
It can also be enlightening simply to see how different levels of products within a given manufacturer's lineup compare. For example, the graph above shows a comparison of the Nikon D60, D90, and D700. These three products represent three very different capability levels and price points within Nikon's current lineup, but it's interesting to compare them to see just how much you gain as you move up the model line. Here, we're looking at SNR at high ISOs. I positioned the cursor such that it intersected the D700's curve right at the measured value of ISO 6,400. That horizontal line intersects the D90's curve at right about ISO 3,200, and the curve for the D60 just a bit shy of the ISO 1,600 mark. The D90 thus gives you a bit more than a 1-stop improvement in image noise, as its noise at ISO 3,200 is slightly better than that of the D60 at ISO 1,600. The D700 gives you yet another full f-stop of improvement, producing that same amount of noise at ISO 6,400. Note, though, that the D60 is shooting at pretty close to ISO 1,600 when you have its ISO set to that level, while the D90's ISO would need to be set somewhere between ISO 3,200 and 6,400 to get a true value of 3,200, and the D700's ISO would need to be set somewhere between ISO 6,400 and 12,800 to get a true value of 6,400.
Here's another interesting comparison, as it would relate to an upgrade: The graph above shows SNR for the Nikon D70, D80, and D90, normalized to a standard print size. As you can see, the D80 offered essentially no improvement in this particular parameter over the D70, but the D90 brings a very clear improvement.
Summary
For the first time, the photography community has objective, unbiased information on RAW image quality available to assist in purchase decisions and judge whether any given RAW converter is delivering the full promise of a camera's RAW files. (Not to mention to help resolve arguments, as well ;-) DxO already has a significant number of cameras represented on DxOMark.com, but we hope they'll continue to expand the listing to include the complete range of both consumer and professional models. It could be argued that average consumers may not care about the inner details of their camera's RAW capability, but IR and other review organizations can certainly use this kind of information to help inform our readers' decisions. Getting newly-released cameras into the database quickly should also be a key aim, so it can be of current usefulness for enthusiasts making new-camera purchase decisions.
Bottom line, DxOMark.com represents an exciting new dimension in digital SLR performance evaluation, one that we expect to use extensively in our own review process going forward.
 Image Quality: What's Really Going on in the Sensor? (A solution is at hand)