Nikon D2Xs Imatest Results
We routinely Norman Koren's excellent "Imatest" analysis program for quantitative, thoroughly objective analysis of digicam test images. I highly recommend it to our technically-oriented readers, as it's far and away the best, most comprehensive analysis program I've found to date.
My comments below are just brief observations of what we see in the Imatest results. A full discussion of all the data Imatest produces is really beyond the scope of this review: Visit the Imatest web site for a full discussion of what the program measures, how it performs its computations, and how to interpret its output.
Here's some of the results produced by Imatest for the Nikon D2Xs:
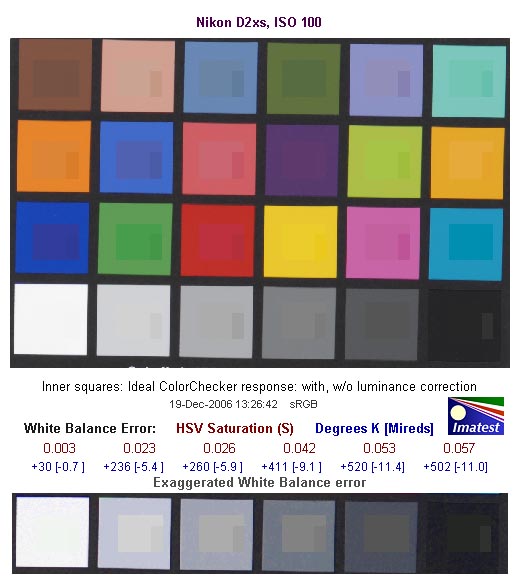
Color Accuracy
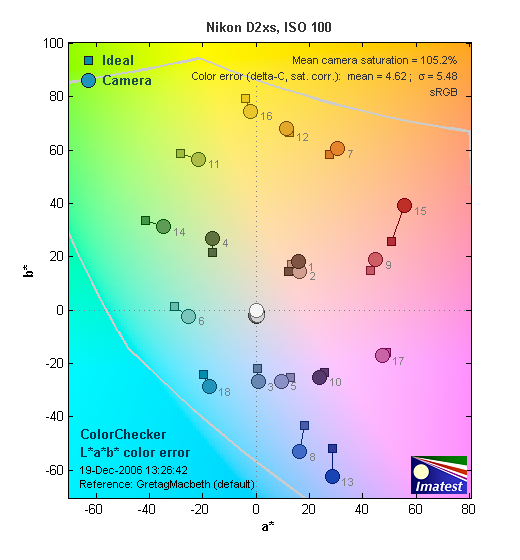
The Nikon D2Xs showed really excellent color accuracy, easily in the top rank of cameras we've tested. It ran a little hot (oversaturated) with strong reds, less so with some blues (a fairly common response with this target, the MacBeth ColorChecker), and was very slightly undersaturated in some greens and yellows. Hue accuracy is exceptionally good, only slight hue shifts in various parts of the spectrum. Average saturation was 105.2% (oversaturated by 5.2%, mostly in the reds and blues as well), average "delta-E" color error was only 4.62 after correction for saturation. All in all, really excellent color accuracy, among the best we've seen.
Color Analysis
This image shows how the Nikon D2Xs actually rendered the colors of the MacBeth chart, compared to a numerically ideal treatment. In each color swatch, the outer perimeter shows the color as actually captured by the camera, the inner square shows the numerically ideal color, after correcting for the luminance of the photographed chart (as determined by a second-order curve fit to the values of the gray swatches), and the small rectangle inside the inner square shows the numerically ideal color, without any luminance correction. This image shows the excellent hue accuracy, as well as a gamma curve that results in an overexposure of highly saturated swatches. (We've seen this in a number of cameras, increasing the "punch" of images by lightening bright colors a little, while actually keeping both the hue and saturation level very close to technically accurate values.)
Gray Patch Tone and Noise Analysis
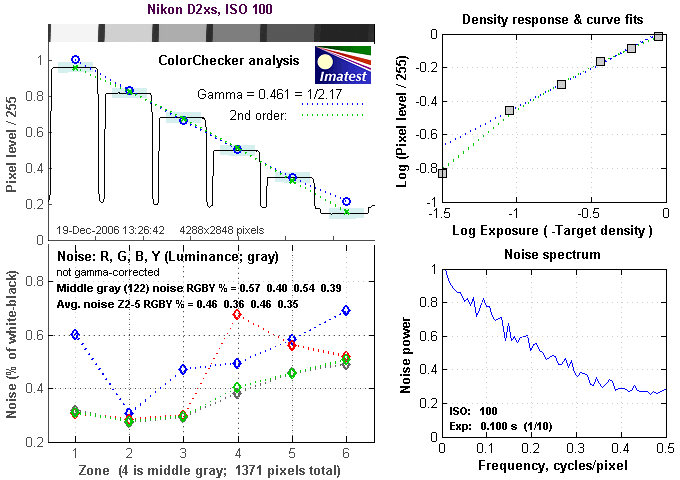
There's a lot in this particular graph, a lot more than we have room to go into here. Bottom line, the Nikon D2Xs's noise levels are low at low ISO, with a fairly average frequency spectrum. In comparing these graphs with those from other competing cameras, I've found that the Noise Spectrum graph at lower right is the most important. Cameras that manage to shift their noise spectrum to higher frequencies have much finer-grained noise structures, making their noise less visually objectionable. In the graph above, this would show up as a noise spectrum curve that remained higher on the right side, representing higher noise frequencies. The champion at this was the Canon EOS-1Ds Mark II, which produced remarkably fine-grained image noise, even at very high ISOs. The D2Xs's noise spectrum more conventional, with more weight on the left side of the noise spectrum plot than the 1Ds managed, similar in this respect to most other DSLRs we've tested.
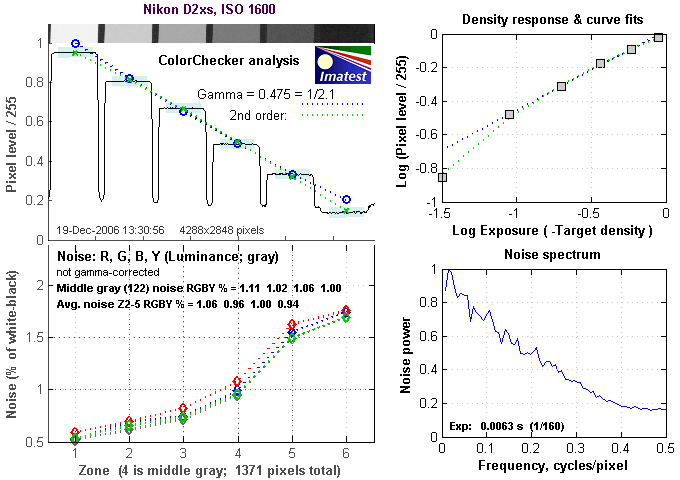
Here's the same set of noise data at ISO 1,600. Here, the Noise Spectrum graph is shifted a bit more toward the left-hand, lower-frequency side than it was at ISO 100, coarsening the "grain" of the image noise patterns somewhat. In the D2Xs, while the frequency distribution of the noise shifts more to the lower range, its overall noise amplitude remains pretty low.
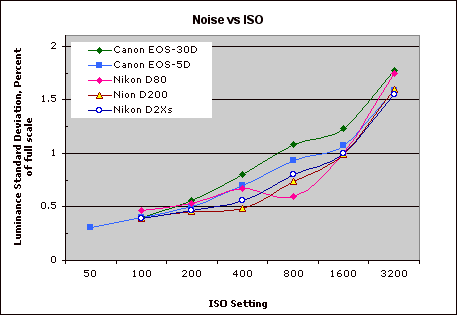
This chart compares the Nikon D2Xs's noise performance over a range of ISOs against that of other cameras. While we continue to show noise plots of this sort because readers ask for them, we each time point out that the noise magnitude is only a small part of the story, the grain pattern being much more important. In the case of the D2Xs, we were impressed when we subjected the D2Xs's images to the real-world test of printing them out at 8x10 and 13x19 inches on the Canon i9900 printer in our studio. While we found some noise and some loss of subtle subject detail in ISO 1,600 shots, even 13x19 inch prints were quite acceptable-looking (at least to our eyes).
Dynamic Range Analysis
A key parameter in a digital camera is its Dynamic Range, the range of brightness that can be faithfully recorded. At the upper end of the tonal scale, dynamic range is dictated by the point at which the RGB data "saturates" at values of 255, 255, 255. At the lower end of the tonal scale, dynamic range is determined by the point at which there ceases to be any useful difference between adjacent tonal steps. Note the use of the qualifier "useful" in there: While it's tempting to evaluate dynamic range as the maximum number of tonal steps that can be discerned at all, that measure of dynamic range has very little relevance to real-world photography. What we care about as photographers is how much detail we can pull out of the shadows before image noise becomes too objectionable. This, of course, is a very subjective matter, and will vary with the application and even the subject matter in question. (Noise will be much more visible in subjects with large areas of flat tints and subtle shading than it would in subjects with strong, highly contrasting surface texture.)
What makes most sense then, is to specify useful dynamic range in terms of the point at which image noise reaches some agreed-upon threshold. To this end, Imatest computes a number of different dynamic range measurements, based on a variety of image noise thresholds. The noise thresholds are specified in terms of f-stops of equivalent luminance variation in the final image file, and dynamic range is computed for noise thresholds of 1.0 (low image quality), 0.5 (medium image quality), 0.25 (medium-high image quality) and 0.1 (high image quality). For most photographers and most applications, the noise thresholds of 0.5 and 0.25 f-stops are probably the most relevant to the production of acceptable-quality finished images, but many noise-sensitive shooters will insist on the 0.1 f-stop limit for their most critical work.
The image below shows the test results from Imatest for an in-camera JPEG file from the Nikon D2Xs with a nominally-exposed density step target (Stouffer 4110), with the D2Xs's contrast setting at its default position.
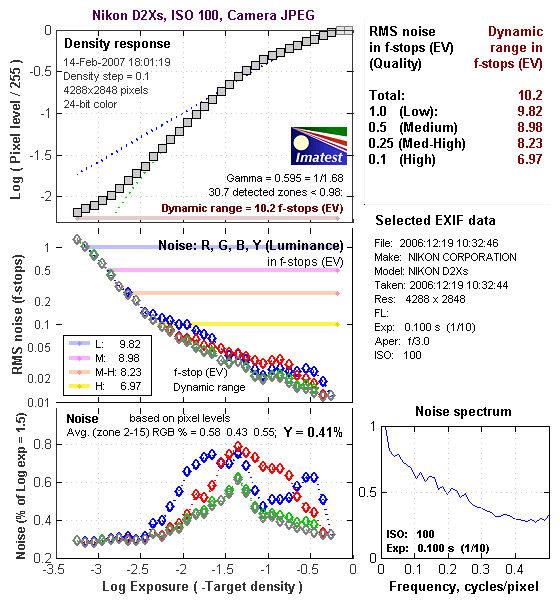
These are actually only modest numbers for an in-camera JPEG from a high-end DSLR, but the dynamic range number at "high" quality itself (6.97) isn't the most important thing to look at here. A dynamic range of just under 7 f-stops at high image quality is at the lower end of the range we've measured on other DSLRs, but that said, is actually only about a third of an f-stop below the best DSLRs we've tested (apart from the Fuji S3 Pro). Equally important though, is the shape of the tone curve.
More significant than the absolute dynamic range is how the curve tails off at both the highlight and shadow ends, showing the extent to which the camera makes a smooth transition from quarter-tones to both highlight and shadow, making for smooth-looking images even after considerable tone-curve adjustment on the computer. The D2Xs' tone curve is about average in this respect, matching the behavior of many other DSLRs.
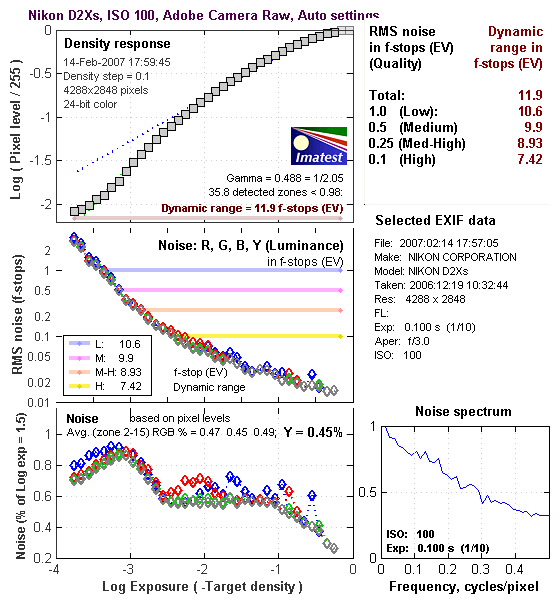
As usual, Adobe Camera Raw (ACR) manages to extract a fair bit more dynamic range from the RAW (NEF) file than does the camera (or Nikon's software, for that matter) itself. Letting ACR make its own choices for its settings, it produced a file with a dynamic range of 7.42 stops, using the high-quality noise threshold of 0.1 stops; a half-stop more than found in the camera's own JPEGs. As you relax the noise threshold criteria, ACR's advantage over the camera's JPEGs, hitting a high of a full-stop at the "Medium" level, which allows for up to a half-stop of noise in the image.
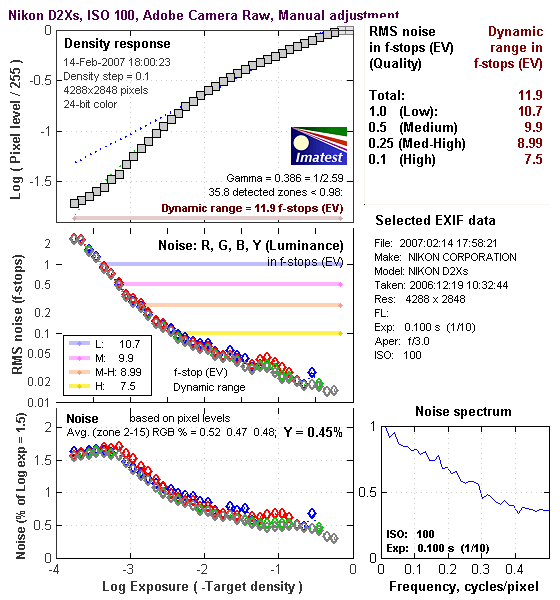
Twiddling ACR's controls manually, we managed to get just a little more dynamic range than ACR's auto settings managed, but the overall improvement was strictly minimal. (We've found this to be the case more often than not.)
Dynamic Range, the bottom line:
While we don't have the results of a RAW conversion available to judge by at this point, the JPEG images straight from the D2Xs show really excellent dynamic range. Previously, the champion for dynamic range from Camera JPEGs (leaving out the Fujifilm S3 Pro, with its dual-pixel sensor technology) was the Nikon D50, with the Canon EOS-20D coming in close behind, exceeding the D50 at some noise thresholds, falling behind very slightly at others. Looking at the table below, the D2Xs comes in at the lower end of the range of SLRs we've tested, both for in-camera JPEGs, and for RAW files processed through Adobe Camera Raw.
To get some perspective, here's a summary of the Nikon D2Xs's dynamic range performance, and how it compares to other digital SLRs that we also have Imatest dynamic range data for. (Results are arranged in order of decreasing dynamic range at the "High" quality level.):
| Dynamic Range (in f-stops) vs Image Quality (At camera's minimum ISO) |
||||
| Model | 1.0 (Low) |
0.5 (Medium) |
0.25 (Med-High) |
0.1 (High) |
| Fujifilm S3 Pro (Adobe Camera Raw 2) |
12.1 | 11.7 | 10.7 | 9.0 |
| Pentax K-100D (Adobe Camera Raw 3.6) |
11.3 | 10.3 | 9.51 | 8.23 |
| Canon EOS-1Ds Mark II (Adobe Camera Raw 3) |
11.2 | 10.3 | 9.4 | 8.14 |
| Fujifilm S3 Pro | -- | 9.9 | 9.4 | 7.94 |
| Canon Digital Rebel XTi (Adobe Camera Raw 3.6) |
10.8 | 9.88 | 9.18 | 7.84 |
| Canon EOS-5D (Adobe Camera Raw 3) |
11.0 | 10.4 | 9.21 | 7.83 |
| Canon EOS-5D (Camera JPEG) |
10.2 | 9.68 | 8.82 | 7.65 |
| Nikon D200 (Adobe Camera Raw 3) |
10.6 | 9.65 | 8.96 | 7.61 |
| Nikon D80 (Adobe Camera Raw 3.6) |
11.1 | 10.4 | 9.42 | 7.51 |
| Nikon D2Xs (Adobe Camera Raw 3.6) |
10.6 | 9.9 | 8.93 | 7.42 |
| Nikon D50 | 10.7 | 9.93 | 8.70 | 7.36 |
| Canon EOS 20D | 10.3 | 9.66 | 8.85 | 7.29 |
| Nikon D40 | 10.4 | 9.8 | 8.89 | 7.28 |
| Nikon D80 (Camera JPEG) |
10.1 | 9.43 | 8.48 | 7.12 |
| Canon Digital Rebel XT | 10.3 | 9.51 | 8.61 | 7.11 |
| Nikon D200 (Camera JPEG) |
-- | 9.07 | 8.36 | 7.11 |
| Olympus EVOLT | 10.8 | 9.26 | 8.48 | 7.07 |
| Canon Digital Rebel XTi (Camera JPEG) |
9.83 | 9.10 | 8.27 | 7.04 |
| Canon EOS-1Ds Mark II (Camera JPEG) |
10.3 | 9.38 | 8.6 | 7.04 |
| Canon Digital Rebel | 10.1 | 9.11 | 8.47 | 6.97 |
| Nikon D2Xs | 9.82 | 8.98 | 8.23 | 6.97 |
| Pentax *istDs | 10.2 | 10 | 8.87 | 6.9 |
| Pentax K-100D (Camera JPEG) |
10.3 | 9.3 | 8.39 | 6.73 |
| Nikon D2x | -- | 8.93 | 7.75 | 6.43 |
| Nikon D70S | 9.84 | 8.69 | 7.46 | 5.85 |
| Nikon D70 | 9.81 | 8.76 | 7.58 | 5.84 |
The results shown in the table are interesting. One of the first things that struck me when I initially looked at test data for a wide range of d-SLRs, was that here again, purely analytical measurements don't necessarily correlate all that well with actual photographic experience. There's no question that the Fuji S3 Pro deserves its place atop the list, as its unique "SR" technology does indeed deliver a very obvious improvement in tonal range in the highlight portion of the tonal scale. I was surprised to see the analytical results place the Olympus EVOLT as highly as they did, given that our sense of that camera's images was that they were in fact noisier than those of many other d-SLRs that we looked at. In the other direction, I was quite surprised to see the Nikon D2x place as low on the listings as it did, given that we found that camera's shadow detail to be little short of amazing. (The D2Xs does well in that area too, but not nearly to the level reached by the original D2x.)
While the Nikon D2Xs comes in at the low end of the range of digital SLRs we've tested, it's worth noting that only a third of an f-stop separates most of the models shown in the table above.
As I always say though, at the end of the day, I think you have to take the figures here with a grain of salt, and look at actual images with your own eyes to see what you make of each camera's tonal range and noise levels. We'll continue performing these dynamic range tests on the digital SLRs that we review, but (just as with the laboratory resolution target results), we suggest that you not rely on them exclusively for making your purchase decisions.
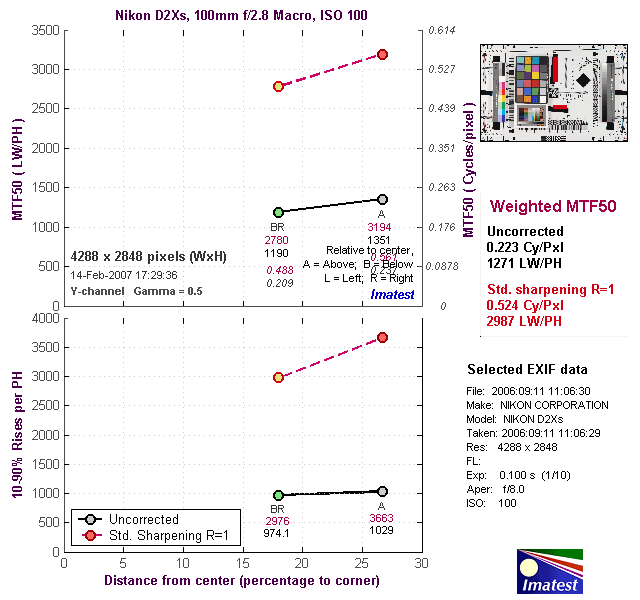
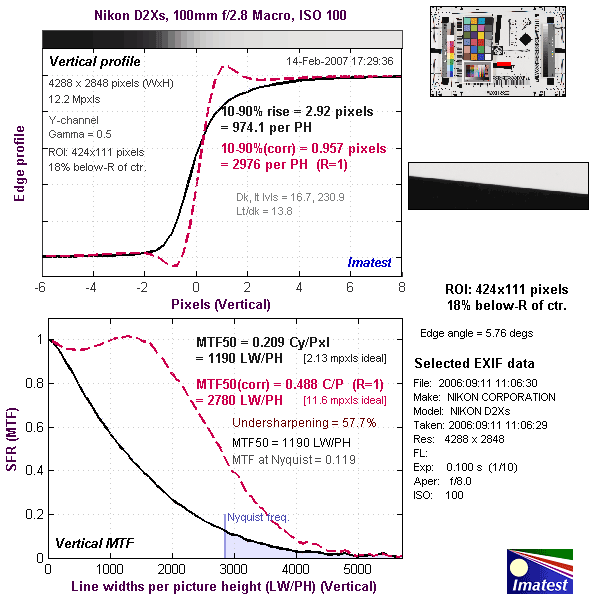
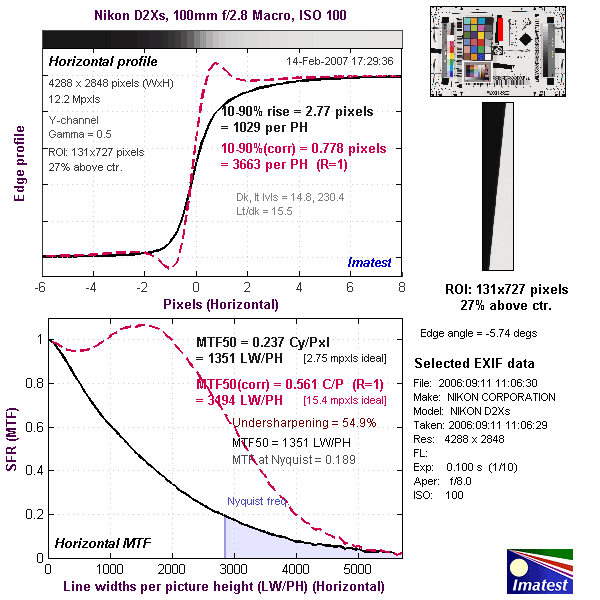
The chart above shows consolidated results from spatial frequency response measurements in both the horizontal and vertical axes. The "MTF 50" numbers tend to correlate best with visual perceptions of sharpness, so those are what I focus on here. The uncorrected resolution figures are 1,351 line widths per picture height in the horizontal direction (corresponding to the vertically-oriented edge), and 1,190 lines along the vertical axis (corresponding to the horizontally-oriented edge). These are both rather low numbers, but reflect the very conservative in-camera sharpening of the D2Xs. Correcting to a "standardized" sharpening with a one-pixel radius greatly increased edge sharpness, resulting in an average of 2,987 LW/PH, a very high value. (Reflecting the fact that the standard sharpening operator in Imatest slightly oversharpened the D2Xs' edge profiles.
To see what's going on, refer to the plots below, which show the actual edge profiles for both horizontal and vertical edges, in both their original and corrected forms. Here, you can see that the as-shot edge profiles have very rounded shoulders. As discussed in the main part of this review, the D2Xs's unadjusted JPEG images make good-looking (if somewhat soft) prints as large as 13 x19 inches. For the ultimate in sharpness though, dial down the camera's internal sharpening and process the resulting images after the fact in Photoshop or other image-processing application to bring out the maximum detail without introducing sharpening artifacts. When you do this, images from the D2Xs can make very clean, sharp-looking prints as large as 20x30 inches.
 Fujifilm GFX 50S Review
 Fujifilm X-T3 Review
 Olympus E-M5 III Review

Follow Imaging Resource