Nikon D70SNikon updates its midrange SLR with improved focusing, larger LCD, a new menu interface, and more.<<Reference: Datasheet :(Previous) | (Next): D70S Sample Images>> D70S Imatest ResultsReview First Posted: 06/30/2005 |
Detailed analysis of the Nikon D70S images, from Imatest(tm)
I've recently begun using Norman Koren's excellent "Imatest" analysis program for quantitative, thoroughly objective analysis of digicam test images. I highly commend it to our technically-oriented readers, as it's far and away the best, most comprehensive analysis program I've found to date.
My comments below are just brief observations of what I see in the Imatest results. A full discussion of all the data Imatest produces is really beyond the scope of this review: Visit the Imatest web site for a full discussion of what the program measures, how it performs its computations, and how to interpret its output.
Here's some of the results produced by Imatest for the Nikon D70S:
Color Accuracy
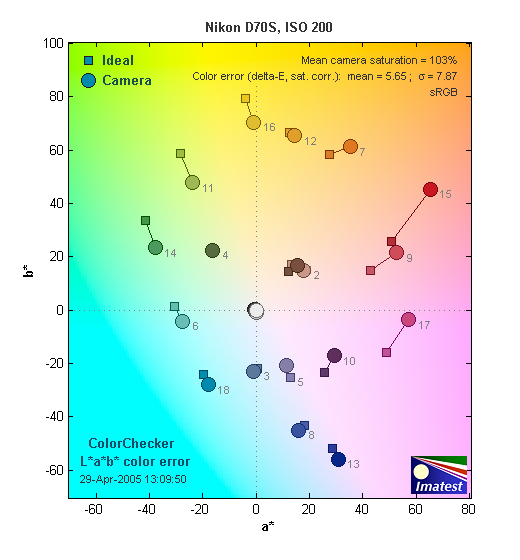
The Nikon D70S showed good but not exceptional color accuracy. It tended to overemphasize strong reds quite a bit, while slightly undersaturating greens, yellow-greens, and yellows. Other colors were rendered very accurately however. Average saturation was 103% (oversaturated by 3.0%, almost entirely in the reds), average "delta-E" color error was 5.65.
Color Analysis
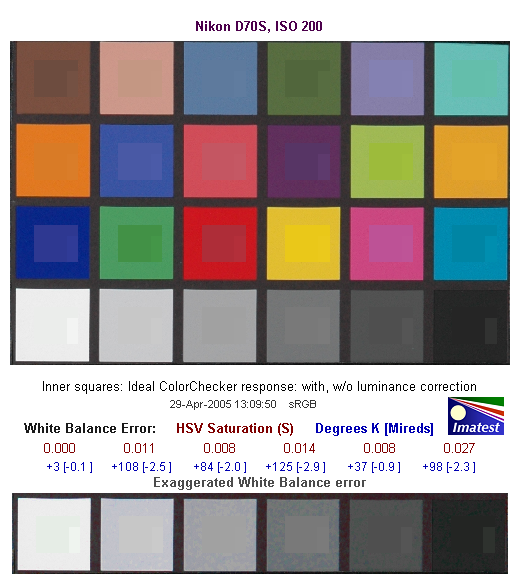
These images show the color behavior of the D70S directly. In each color swatch, the outer perimeter shows the color as actually captured by the camera, the inner square shows the color after correcting for the luminance of the photographed chart (as determined by a 2nd-order curve fit to the values of the gray swatches), and the small rectangle inside the inner square shows what the color should actually be, based on perfect rendering to the sRGB color space.
Gray Patch Tone and Noise Analysis
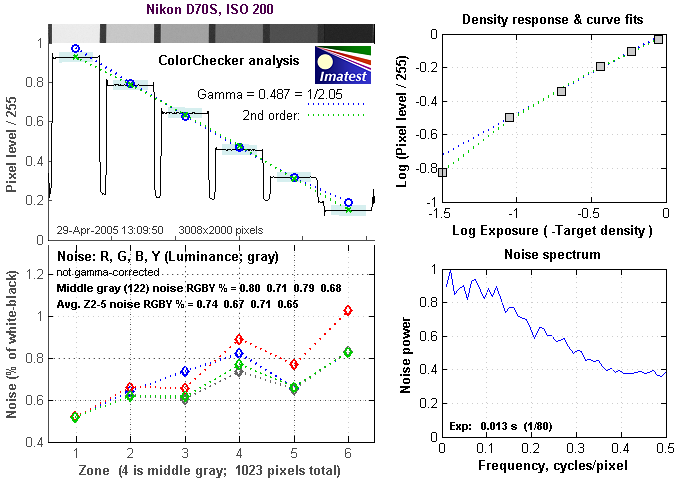
There's a lot in this particular graph, a lot more than I have room to go into here. Bottom line, the D70S' noise levels are pretty low, and the noise spectrum is such that the noise has a fairly fine-grained character to it. At higher ISOs (not shown here), the noise spectrum shifts somewhat toward lower frequencies, resulting in a coarser grain pattern, but the overall effect isn't too severe, and noise remains pretty well controlled even at ISO 1600.
This chart compares the Nikon D70S' noise performance over a range of ISOs against that of other cameras. As you can see, the D70S' noise levels are just ever so slightly higher than those of most of its competitors across the ISO range. What isn't shown here though, is the "grain" structure of the camera nor the extent to which it trades away fine detail as the ISO is increased. The D70S' noise is a little coarser-grained than the best of its competition, but it does manage to strike a pretty good balance between trading away subtle subject detail or allowing noise too free a reign. (In the chart above, the Konica Minolta Maxxum 7D posts very low noise numbers, but its high-ISO images are very soft as a result.)
Dynamic Range Analysis
A key parameter in a digital camera is its Dynamic Range, the range of brightness that can be faithfully recorded. At the upper end of the tonal scale, dynamic range is dictated by the point at which the RGB data "saturates" at values of 255, 255, 255. At the lower end of the tonal scale, dynamic range is determined by the point at which there ceases to be any useful difference between adjacent tonal steps. Note the use of the qualifier "useful" in there: While it's tempting to evaluate dynamic range as the maximum number of tonal steps that can be discerned at all, that measure of dynamic range has very little relevance to real-world photography. What we care about as photographers is how much detail we can pull out of the shadows before image noise becomes too objectionable. This, of course, is a very subjective matter, and will vary with the application and even the subject matter in question. (Noise will be much more visible in subjects with large areas of flat tints and subtle shading than it would in subjects with strong, highly contrasting surface texture.)
What makes most sense then, is to specify useful dynamic range in terms of the point at which image noise reaches some agreed-upon threshold. To this end, Imatest computes a number of different dynamic range measurements, based on a variety of image noise thresholds. The noise thresholds are specified in terms of f-stops of equivalent luminance variation in the final image file, and dynamic range is computed for noise thresholds of 1.0 (low image quality), 0.5 (medium image quality), 0.25 (medium-high image quality) and 0.1 (high image quality). For most photographers and most applications, the noise thresholds of 0.5 and 0.25 f-stops are probably the most relevant to the production of acceptable-quality finished images.
The image below shows the test results from Imatest for the Nikon D70S.
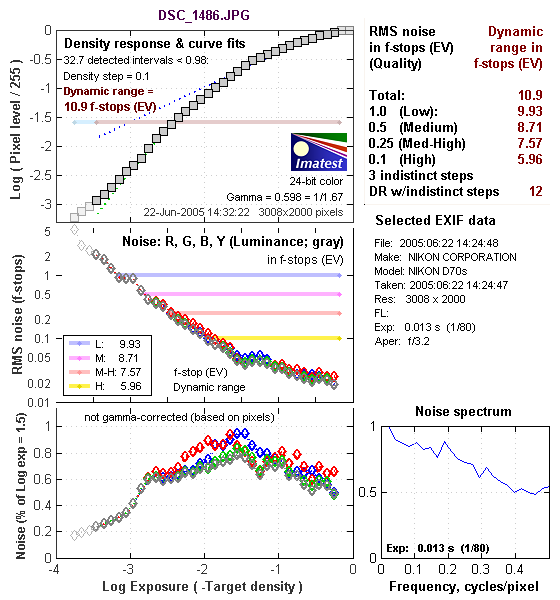
With that as background, here's how the Nikon D70S performed, and how it compares to other digital SLRs that we also have Imatest dynamic range data for. (Results are arranged in order of decreasing dynamic range at the "High" quality level.):
| Dynamic Range (in f-stops) vs Image Quality (At camera's minimum ISO) |
||||
| Model | 1.0 (Low) |
0.5 (Medium) |
0.25 (Med-High) |
0.1 (High) |
| Fujifilm S3 Pro | -- | 10.3 | 9.02 | 7.9 |
| Nikon D50 | 10.7 | 9.93 | 8.70 | 7.36 |
| Canon EOS 20D | 10.3 | 9.66 | 8.85 | 7.29 |
| Canon Digital Rebel XT | 10.3 | 9.51 | 8.61 | 7.11 |
| Olympus EVOLT | 10.8 | 9.26 | 8.48 | 7.07 |
| Canon Digital Rebel | 10.1 | 9.11 | 8.47 | 6.97 |
| Pentax *istDs | 10.2 | 10 | 8.87 | 6.9 |
| Nikon D2x | -- | 8.93 | 7.75 | 6.43 |
| Nikon D70S | 9.84 | 8.69 | 7.46 | 5.85 |
| Nikon D70 | 9.81 | 8.76 | 7.58 | 5.84 |
The results shown in the table are interesting. One of the first things that struck me when I arranged all the data, was that here again, purely analytical measurements don't necessarily correlate all that well with actual photographic experience. There's no question that the Fuji S3 Pro deserves its place atop the list, as its unique "SR" technology does indeed deliver a dramatic improvement in tonal range in the highlight portion of the tonal scale. I was surprised to see the analytical results place the Olympus EVOLT as highly as they did, given that our sense of that camera's images was that they were in fact noisier than those of many other d-SLRs that we looked at. In the other direction, I was quite surprised to see the Nikon D2x place as low on the listings as it did, given that we found that camera's shadow detail to be little short of amazing.
One thing that's going on here though, is that we tested each camera at its lowest ISO setting, which should produce best-case noise levels. This is in fact what many photographers will be most interested in, but it does perhaps place the Nikons at a disadvantage, as their lowest ISO setting is 200, as compared to the ISO 100 settings available on most other models. One of the biggest surprises was the high placement of the Nikon D50, particularly given its positioning as an inexpensive, entry-level camera.
Bottom line, I think you have to take the figures here with a grain of salt, and look at actual images with your own eyes to see what you make of each camera's tonal range and noise levels. We'll continue performing these dynamic range tests on the digital SLRs that we review, but (just as with the laboratory resolution target results), we suggest that you not rely on them exclusively for making your purchase decisions.
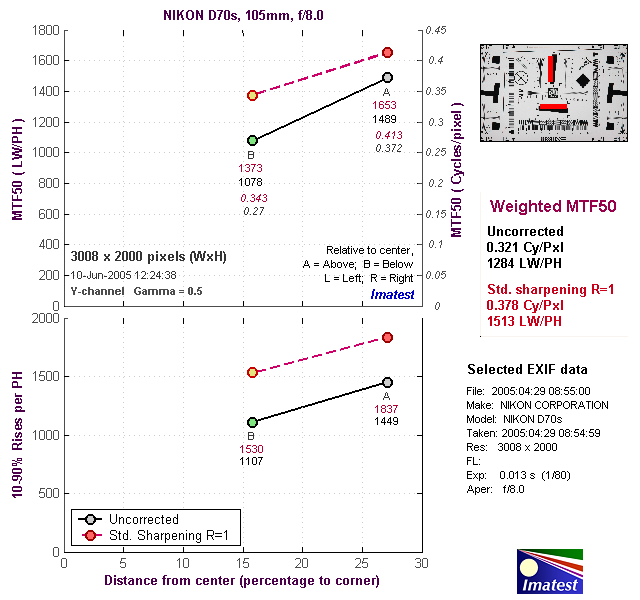
The chart above shows consolidated results from spatial frequency response measurements in both the horizontal and vertical axes. The "MTF 50" numbers tend to correlate best with visual perceptions of sharpness, so those are what I focus on here. The uncorrected resolution figures are 1449 line widths per picture height in the horizontal direction (corresponding to the vertically-oriented edge), and 1107 along the vertical axis (corresponding to the horizontally-oriented edge), for a combined average of 1284 LW/PH. Correcting to a "standardized" sharpening with a one-pixel radius increases this number a lot, to an average of 1513 LW/PH. Both uncorrected and corrected numbers are solidly in the middle of the range you'd expect from a 6-megapixel d-SLR.
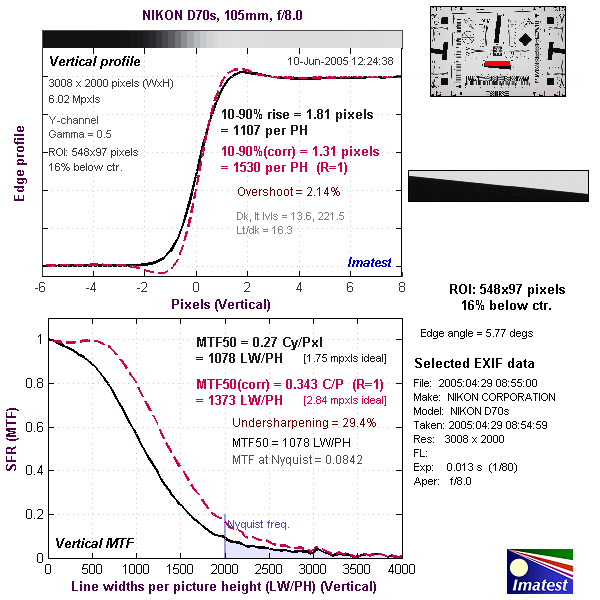
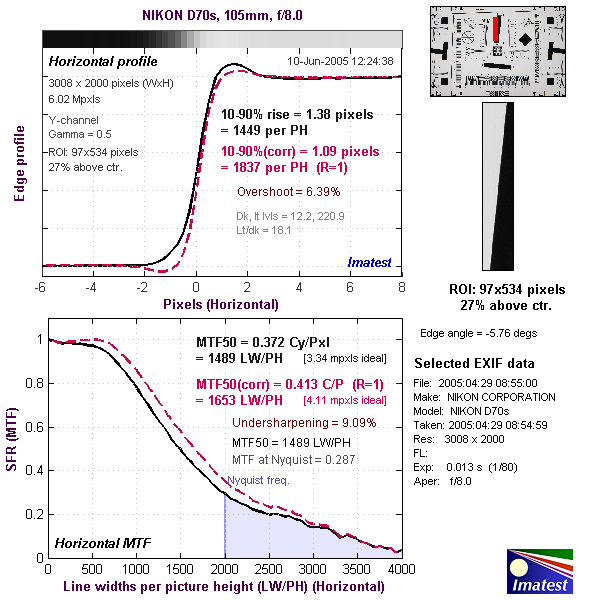
For the real techno-geeks, the two plots below show the actual edge response of the Nikon D70S, for horizontal and vertical edges. Here, we can see that the D70S' default sharpening does a very nice job in the vertical direction, producing almost no "overshoot" that would tend to produce halos around objects. Along the horizontal axis, there's more overshoot, but it's still fairly well-controlled. The fact that there is overshoot horizontally does suggest a need to shoot with the sharpening set at its lowest value and then sharpen in Photoshop(tm) or other imaging application post-capture, to get the best results.
Reader Comments! --> Visit our discussion forum for the Nikon D70S!

Follow Imaging Resource: