Olympus EVOLT E-300By: Shawn Barnett and Dave Etchells8.0 megapixels, ZUIKO DIGITAL lens mount, digital SLR design, and loads of features! <<E-300 Sample Images :(Previous) | (Next): Print-Friendly Review Version>> E-300 Imatest ResultsReview First Posted: 11/08/2004, Updated: 03/12/2005 |
Detailed analysis of the Olympus eVolt E-300 images, from Imatest(tm)
I've recently begun using Norman Koren's excellent "Imatest" analysis program for quantitative, thoroughly objective analysis of digicam test images. I highly commend it to our technically-oriented readers, as it's far and away the best, most comprehensive analysis program I've found to date. (And with an introductory price of only $59, it's hard to beat.)
My comments below are just brief observations of what I see in the Imatest results. A full discussion of all the data Imatest produces is really beyond the scope of this review: Visit the Imatest web site for a full discussion of what the program measures, how it performs its computations, and how to interpret its output.
Here's some of the results produced by Imatest for the Olympus E-300:
Color Accuracy

Overall, the Olympus eVolt E-300's color management was a bit less accurate than average, particularly in the blue part of the spectrum. Cyans are shifted toward blue (generally a good thing, as it tends to make sky colors look better, but blues were also shifted toward purple, and yellows and greens were somewhat undersaturated. In the real-world photos, I saw some of the tendency to render blues with purple tints, but other colors looked better than what the plot above might indicate. On average, color saturation of swatches on the MacBeth ColorChecker(tm) chart are 107.1% of their ideal values. (An average oversaturation of 7.1%, resulting from the oversaturation of blues and bright reds.) Average "delta-E" color error is 6.98, a bit higher than average, but not terrible. The variance in the delta-E was rather high at 8.71 though.
Color Analysis
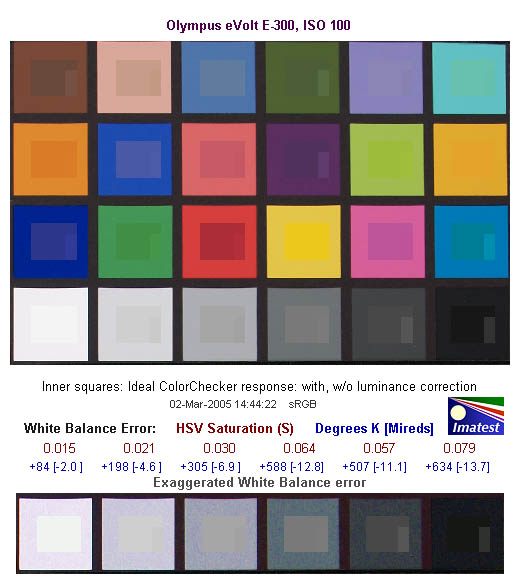
These images show the color behavior of the Olympus eVolt E-300 more directly. In each color swatch, the outer perimeter shows the color as actually captured by the camera, the inner square shows the color after correcting for the luminance of the photographed chart (as determined by a 2nd-order curve fit to the values of the gray swatches), and the small rectangle inside the inner square shows what the color should actually be, based on perfect rendering to the sRGB color spacer. From this plot, we can see that while the E-300 actually matches most colors fairly closely on a visual basis, the most apparent deviation being in the overly-rich blues, and in brightness variations more so than the color values themselves.
Gray Patch Tone and Noise Analysis
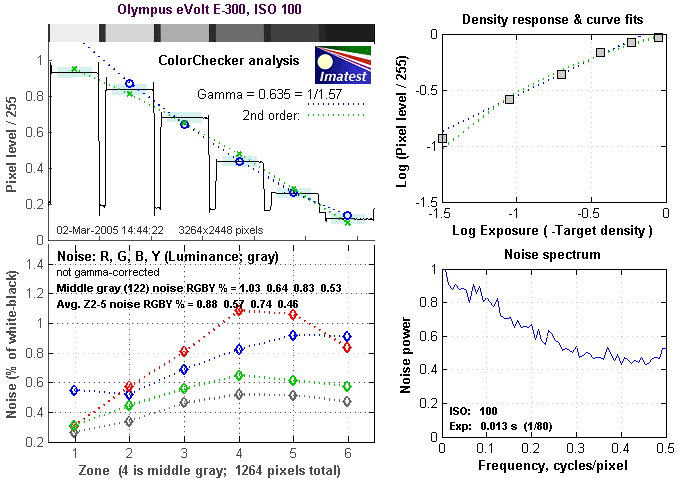
There's a lot in this particular graph, a lot more than I have room to go into
here. Bottom line, the eVolt's noise levels are a bit higher than average across
the board. Oddly, at low ISO, there's quite a lot of low frequency content in
its noise, but it doesn't affect image quality that much because the overall
level is so low. As you move to higher ISOs, higher frequencies dominate in
the noise spectrum, which helps make the relatively high level of the noise
look less objectionable than it would otherwise. At high ISO, the noise has
a pretty fine-grained character that doesn't look all that bad.
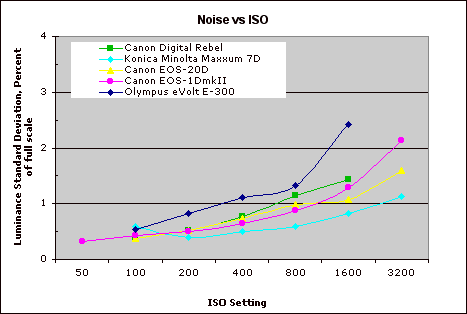
This chart compares the eVolt's noise performance over a range of ISOs against that of competing cameras. As you can see, its absolute noise levels are higher than those of most competing models across the board. (Although there aren't at this point any 8 megapixel cameras in its price range to compare it with.) What this chart (and others like it, published by other reviewers) doesn't show is the frequency characteristics of the image noise, which has a great deal to do with how objectionable it is to the human eye, not to mention what the camera does to subject detail in its pursuit of low image noise. In the case of the eVolt E-300, its image noise is fairly fine grained, which helps make it less obtrusive than it would be otherwise. At high ISOs, it also manages to avoid trading away subject detail in favor of lower noise, with the result that its images look quite crisp, even at ISO 1600.
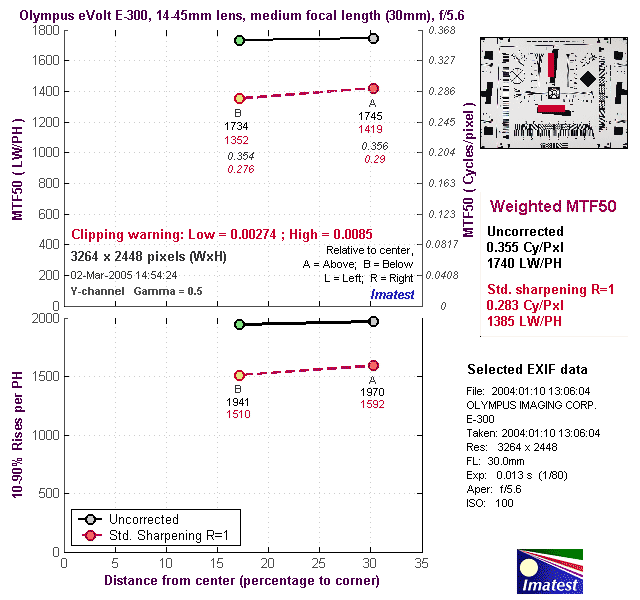
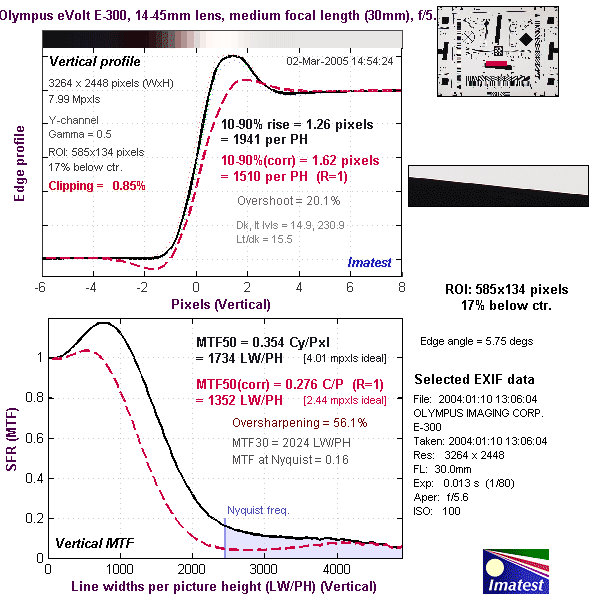
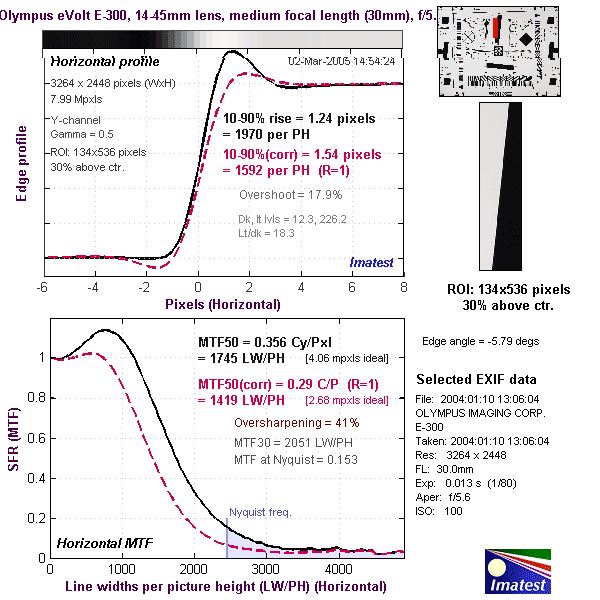
The chart above shows consolidated results from spatial frequency response
measurements in both the horizontal and vertical axes. The "MTF 50"
numbers tend to correlate best with visual perceptions of sharpness, so those
are what I focus on here. The eVolt by default somewhat oversharpens its images,
hence the much lower effective resolution numbers once the image was normalized
to a standard 1-pixel sharpening. Bottom line, the average uncorrected resolution
of 1740 line widths/picture height dropped to1385 LW/PH when corrected to a
standard sharpening level. The corrected value is decent, but on the low side
for an 8-megapixel camera.
For the real techno-geeks, the two plots below show the actual edge response
of the Olympus E-300, for horizontal and vertical edge. Here you can see the
rather pronounced boost the eVolt's sharpening gives to edges at its default
setting. (Given what I saw in real-world shots, I was surprised to see the E-300
oversharpening this much.)

Follow Imaging Resource: