Canon EOS 30DBy: Shawn Barnett and Dave EtchellsMyriad minor feature and interface tweaks make a great SLR even better. <<EOS 30D Sample Images :(Previous) | (Next): Print-Friendly Review Version>> EOS 30D Imatest ResultsReview First Posted: 04/14/2006 |
Detailed analysis of the Canon EOS-30D images, from Imatest(tm)
I've recently begun using Norman Koren's excellent "Imatest" analysis program for quantitative, thoroughly objective analysis of digicam test images. I highly commend it to our technically-oriented readers, as it's far and away the best, most comprehensive analysis program I've found to date.
My comments below are just brief observations of what I see in the Imatest results. A full discussion of all the data Imatest produces is really beyond the scope of this review: Visit the Imatest web site for a full discussion of what the program measures, how it performs its computations, and how to interpret its output.
Here's some of the results produced by Imatest for the Canon EOS-30D:
Color Accuracy

The Canon EOS-30D showed good color accuracy overall, but tended to get pretty carried away with strong reds. This is a fairly common response with this target (the MacBeth ColorChecker), but the 30D falls toward the upper end of the range of oversaturation of reds that we've seen in pro-level SLRs. Hue accuracy is really excellent though, with only slight shifts in cyans and magentas. Average saturation was 110% (oversaturated by 10%, almost entirely in the reds), average "delta-E" color error was 4.77. (Hue error, after correction for saturation, among the best we've seen.)
Color Analysis
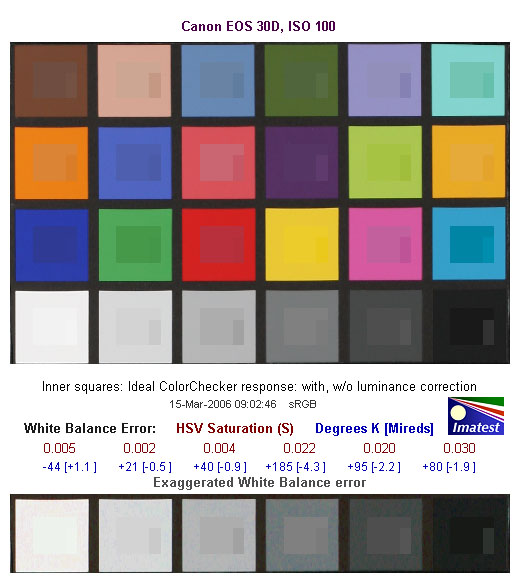
This image shows how the Canon 30D actually rendered the colors of the MacBeth chart, compared to the numerically ideal treatment. In each color swatch, the outer perimeter shows the color as actually captured by the camera, the inner square shows the color after correcting for the luminance of the photographed chart (as determined by a 2nd-order curve fit to the values of the gray swatches), and the small rectangle inside the inner square shows what the color should actually be, based on perfect rendering to the sRGB color space. This image shows the excellent hue accuracy, as well as a gamma curve that results in a slight overexposure of bright swatches, and an underexposure of darker ones. As you might expect from its use of the same imaging engine, the overall response here is very similar to that of the 20D, but the luminance-corrected swatches are a bit closer match than was the case on the 20D, and some of the brighter colors are a bit more highly saturated.
Gray Patch Tone and Noise Analysis
There's a lot in this particular graph, a lot more than I have room to go into here. Bottom line, the Canon EOS-30D's noise levels are quite low at low ISO. In comparing these graphs with those from other competing cameras, I've found that the Noise Spectrum graph at lower right is the most important. Cameras that manage to shift their noise spectrum to higher frequencies have much finer-grained noise structures, making their noise less visually objectionable. In the graph above, this would show up as a noise spectrum curve that remained higher on the right side, representing higher noise frequencies. The champion at this was the Canon EOS-1Ds Mark II, which produced remarkably fine-grained image noise, even at very high ISOs. While good, the noise spectrum of the EOS-30D is much more conventional, with more weight on the left side of the noise spectrum plot than the 1Ds managed.
In the process of writing this analysis, I called up the equivalent noise plots for the EOS-5D, and was amazed by how similar they looked. At ISO 100, they were identical in nearly every parameter, right down to the shape of the noise spectrum. This perhaps isn't too surprising, given that the two cameras probably use the same noise suppression algorithms. It should be noted though, that the noise spectrum graphs are plotted with an x-axis of cycles/pixel. Because the 5D has more pixels across its frame than does the 30D, this means that the same-shaped noise graph will correspond to higher frequency content in the 5D than in the 30D. All else being equal, this could make the 5D's image noise a bit less objectionable than that of the 30D, but in practice, the difference is going to be very slight, and likely not visible to even fairly experienced observers.
Here's the same set of noise data at ISO 1600. Here, the Noise Spectrum graph is shifted a bit more toward the left-hand, lower-frequency side, making for coarser-grained image noise patterns. Once again, not bad, but falling short of the beautiful fine-grained noise patterns that the 1Ds Mark II produced. (The overall level of the noise is just slightly lower in the 30D though, which helps matters a bit.)
This chart compares the Canon EOS-30D's noise performance over a range of ISOs against that of other cameras. While I continue to show noise plots of this sort because readers ask for them, I continue point out that the noise magnitude is only a small part of the story, the grain pattern being much more important. The bottom line really comes when you look at prints from Canon 30D images shot at ISO 1600 and even 3200: The 30D's high-ISO images were surprisingly clean and sharp. Some softness and loss of detail in low-contrast areas of the image were clearly evident at the highest ISO settings, but 8x10 inch prints at ISO 3200 will likely be satisfactory for most users, and ISO 800 shots made beautiful 13x19 inch prints on the Canon i9900 printer in our studio. That said, we can nonetheless see why Canon chose to treat the ISO 3200 option as an "extended" ISO range: Images shot at that ISO clearly showed chroma noise and were noticeably softer than shots at lower ISO settings.
Dynamic Range Analysis
A key parameter in a digital camera is its Dynamic Range, the range of brightness that can be faithfully recorded. At the upper end of the tonal scale, dynamic range is dictated by the point at which the RGB data "saturates" at values of 255, 255, 255. At the lower end of the tonal scale, dynamic range is determined by the point at which there ceases to be any useful difference between adjacent tonal steps. Note the use of the qualifier "useful" in there: While it's tempting to evaluate dynamic range as the maximum number of tonal steps that can be discerned at all, that measure of dynamic range has very little relevance to real-world photography. What we care about as photographers is how much detail we can pull out of the shadows before image noise becomes too objectionable. This, of course, is a very subjective matter, and will vary with the application and even the subject matter in question. (Noise will be much more visible in subjects with large areas of flat tints and subtle shading than it would in subjects with strong, highly contrasting surface texture.)
What makes most sense then, is to specify useful dynamic range in terms of the point at which image noise reaches some agreed-upon threshold. To this end, Imatest computes a number of different dynamic range measurements, based on a variety of image noise thresholds. The noise thresholds are specified in terms of f-stops of equivalent luminance variation in the final image file, and dynamic range is computed for noise thresholds of 1.0 (low image quality), 0.5 (medium image quality), 0.25 (medium-high image quality) and 0.1 (high image quality). For most photographers and most applications, the noise thresholds of 0.5 and 0.25 f-stops are probably the most relevant to the production of acceptable-quality finished images, but many noise-sensitive shooters will insist on the 0.1 f-stop limit for their most critical work.
The image below shows the test results from Imatest for the EOS-30D with a nominally-exposed density step target (Stouffer 4110), using the 30D's "Standard" Picture Style.
These are good numbers, better than those from most digital SLRs we've tested, and only falling short of the EOS-5D's performance by a third of a stop or so. The 30D has a slight "S" shape to its tone curve, helping it to hold onto subtle detail in highlights, although it lacks a similar tail at the shadow end of the curve. Let's also look at how the EOS-30D's images behave when processed from the RAW format.
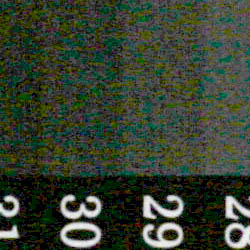
The plots above show the results of the same frame (from the RAW file saved along with the JPEG we analyzed above), processed. Compared to the camera's performance, the dynamic range numbers for Canon's Digital Photo Professional (version 2.1.0.2) seem to show much poorer performance. The key appears to be in how DPP handles noise processing, particularly in the darkest shadows. A clue appears in the tone curve plot, where five "indistinct" steps appear in the shadow end of the curve. Indistinct steps are those for which Imatest finds the difference in average density to be smaller than the variation due to image noise. While the noise spectrum plotted by Imatest actually looks better than those for the camera JPEG, noise magnitudes are higher overall, and the chroma noise is much higher, particularly in the darkest steps. The higher noise levels in the darker steps meant that steps which were easily distinguishable in the camera JPEG were "indistinct" in the DPP version. The crops below show what this looks like in some of the darkest steps resolved.
| From Camera | From DPP |
 |
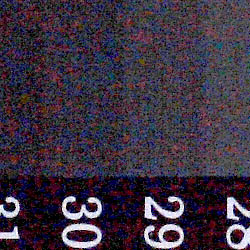 |
| (Brightened radically, by setting Photoshop Levels highlight slider to 30, midtone slider to 1.80) | |
Note that these crops have been radically brightened, using Photoshop's Levels control. (The highlight slider was moved all the way down to 30, the midtone slider was set to 1.80.) These steps are normally very, very (very) dark. Step 29 had a brightness level of only 2.85 units (out of a maximum range of 255). So these levels don't remotely correspond to anything that's photographically significant -- The above images are intended to serve only to explain the greater number of "indistinct" steps reported by Imatest in the DPP-processed version.
As a side note, the above also serves as a cautionary example, showing the folly of blindly counting "distinguishable" steps in a density wedge as some are prone to do. The number of steps you can convince yourself that you can see after wailing on an image in Photoshop has almost nothing to do with a camera's photographically useful dynamic range. This is why we adhere to the standard of an 0.1 f-stop threshold on RMS noise as the criteria for determining useful tonal range.
What about Adobe Camera Raw (ACR) though? Adobe Camera Raw apparently uses data in color channels that aren't blown out in highlights to guess at the brightness data in other channels that are blown out. This lets it extract quite a bit more tonal information from highlight areas that either the camera or (usually) the manufacturer's own RAW-processing software would treat as completely blown out. The downside is that the approach is a little risky, as it may sometimes make incorrect guesses, producing false colors in blown highlights.
Unfortunately, as of the time that I was performing the dynamic range analysis for the 30D, Adobe Camera Raw (version 3.0) wasn't yet supporting the 30D's RAW file format. I'll try to come back to this area once Adobe updates Camera Raw to support the 30D, but can't say just when that will be.
To get some perspective, here's a summary of the EOS-30D's dynamic range performance, and how it compares to other digital SLRs that we also have Imatest dynamic range data for. (Results are arranged in order of decreasing dynamic range at the "High" quality level.):
| Dynamic Range (in f-stops) vs Image Quality (At camera's minimum ISO) |
||||
| Model | 1.0 (Low) |
0.5 (Medium) |
0.25 (Med-High) |
0.1 (High) |
| Fujifilm S3 Pro (Adobe Camera Raw 2) |
12.1 | 11.7 | 10.7 | 9.0 |
| Canon EOS-1Ds Mark II (Adobe Camera Raw 3) |
11.2 | 10.3 | 9.4 | 8.14 |
| Fujifilm S3 Pro | -- | 9.9 | 9.4 | 7.94 |
| Canon EOS-5D (Adobe Camera Raw 3) |
11.0 | 10.4 | 9.21 | 7.83 |
| Canon EOS-5D (Camera JPEG) |
10.2 | 9.68 | 8.82 | 7.65 |
| Nikon D200 (Adobe Camera Raw 3) |
10.6 | 9.65 | 8.96 | 7.61 |
| Nikon D50 | 10.7 | 9.93 | 8.70 | 7.36 |
| Canon EOS 20D | 10.3 | 9.66 | 8.85 | 7.29 |
| Canon EOS 30D | 10.3 | 9.5 | 8.57 | 7.29 |
| Canon Digital Rebel XT | 10.3 | 9.51 | 8.61 | 7.11 |
| Nikon D200 (Camera JPEG) |
-- | 9.07 | 8.36 | 7.11 |
| Olympus EVOLT | 10.8 | 9.26 | 8.48 | 7.07 |
| Canon EOS-1Ds Mark II (Camera JPEG) |
10.3 | 9.38 | 8.6 | 7.04 |
| Canon Digital Rebel | 10.1 | 9.11 | 8.47 | 6.97 |
| Pentax *istDs | 10.2 | 10 | 8.87 | 6.9 |
| Nikon D2x | -- | 8.93 | 7.75 | 6.43 |
| Nikon D70S | 9.84 | 8.69 | 7.46 | 5.85 |
| Nikon D70 | 9.81 | 8.76 | 7.58 | 5.84 |
The results shown in the table are interesting. One of the first things that struck me when I initially looked at test data for a wide range of d-SLRs, was that here again, purely analytical measurements don't necessarily correlate all that well with actual photographic experience. There's no question that the Fuji S3 Pro deserves its place atop the list, as its unique "SR" technology does indeed deliver a very obvious improvement in tonal range in the highlight portion of the tonal scale. I was surprised to see the analytical results place the Olympus EVOLT as highly as they did, given that our sense of that camera's images was that they were in fact noisier than those of many other d-SLRs that we looked at. In the other direction, I was quite surprised to see the Nikon D2x place as low on the listings as it did, given that we found that camera's shadow detail to be little short of amazing.
One thing that's going on here though, is that we tested each camera at its lowest ISO setting, which should produce best-case noise levels. This is in fact what many photographers will be most interested in, but it does perhaps place the Nikons at a disadvantage, as their lowest ISO setting is 200, as compared to the ISO 100 settings available on most other models.
Regardless of the positions of the other cameras though, it's clear from its images that the EOS-30D's noise levels are quite low, a testimony to Canon's advanced CMOS sensor technology and artful anti-noise processing in the Digic II processor.
As I always say though, at the end of the day, I think you have to take the figures here with a grain of salt, and look at actual images with your own eyes to see what you make of each camera's tonal range and noise levels. We'll continue performing these dynamic range tests on the digital SLRs that we review, but (just as with the laboratory resolution target results), we suggest that you not rely on them exclusively for making your purchase decisions.
The chart above shows consolidated results from spatial frequency response measurements in both the horizontal and vertical axes. The "MTF 50" numbers tend to correlate best with visual perceptions of sharpness, so those are what I focus on here. The uncorrected resolution figures are 1452 line widths per picture height in the horizontal direction (corresponding to the vertically-oriented edge), and 1520 along the vertical axis (corresponding to the horizontally-oriented edge), for a combined average of 1486 LW/PH. Correcting to a "standardized" sharpening with a one-pixel radius increases this number very slightly, to an average of 1529 LW/PH. Interestingly, the 30D numbers come in slightly below those of the previous 20D, suggesting that the 30D has had its image processing tweaked somewhat, in ways that serve to decrease the MTF50 numbers slightly. Comparing the edge profiles above to those from the 20D, it appears that the 30D's default in-camera image sharpening works a little more strongly, and over a slightly greater area. Visually, this will tend to produce images that look a bit sharper when printed at typical enlargement sizes (say in the range of 8x10 to 11x14), but that actually contain slightly less information. The underlying resolution of the sensor and optical system does appear to be the same though, based on examination of standard resolution patterns. As always, for best results, capture images with the in-camera sharpening set to a lower value than the default, and sharpen post-capture on a computer, using Adobe Photoshop or other image-processing program.
For the real techno-geeks, the two plots below show the actual edge response of the Canon EOS-30D, for horizontal and vertical edges. Here, we can see that the camera's default sharpening does produce a slight bump in the edge profiles, in both vertical and horizontal directions. This will make its images straight from the camera look a little crisper to the eye, although it does introduce relatively slight "halo" artifacts around sharp edges.

Follow Imaging Resource: