Canon EOS-5DBy: Dave EtchellsSlightly smaller and lighter upgrade brings greater speed and ease of use along with higher res and lower image noise. <<Reference: Datasheet :(Previous) | (Next): E5D Sample Images>> E5D Imatest ResultsReview First Posted: 04/02/2006 |
Detailed analysis of the Canon EOS-5D images, from Imatest(tm)
I've recently begun using Norman Koren's excellent "Imatest" analysis program for quantitative, thoroughly objective analysis of digicam test images. I highly commend it to our technically-oriented readers, as it's far and away the best, most comprehensive analysis program I've found to date.
My comments below are just brief observations of what I see in the Imatest results. A full discussion of all the data Imatest produces is really beyond the scope of this review: Visit the Imatest web site for a full discussion of what the program measures, how it performs its computations, and how to interpret its output.
Here's some of the results produced by Imatest for the Canon EOS-5D:
Color Accuracy
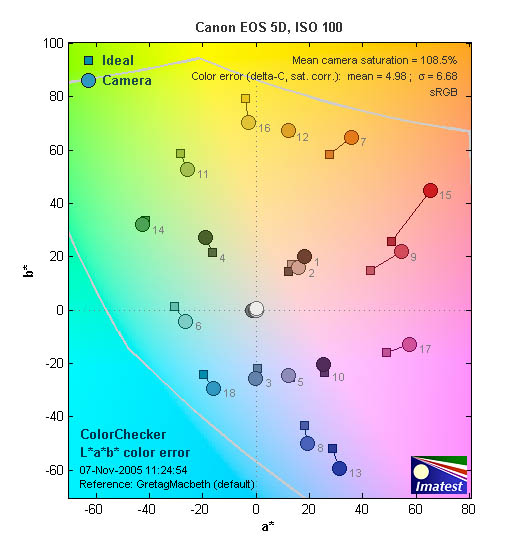
The Canon EOS-5D showed good color accuracy overall, but tended to get pretty carried away with strong reds. This is a fairly common response with this target (the MacBeth ColorChecker), but the 5D falls toward the upper end of the range of oversaturation of reds that we've seen in professional SLRs. Hue accuracy is among the best we've seen though, with only slight shifts in cyans, magentas, and oranges. Average saturation was 108.5% (oversaturated by 8.5%, almost entirely in the reds), average "delta-E" color error was 4.98. (Hue error, after correction for saturation, among the best we've seen.)
Color Analysis
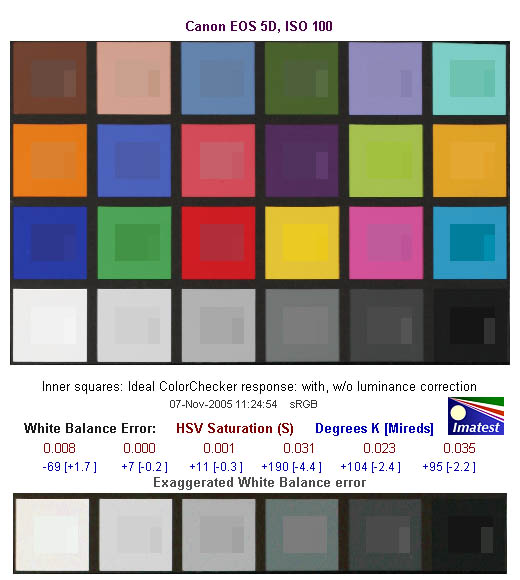
This image shows how the Canon 5D actually rendered the colors of the MacBeth chart, compared to the numerically ideal treatment. In each color swatch, the outer perimeter shows the color as actually captured by the camera, the inner square shows the color after correcting for the luminance of the photographed chart (as determined by a 2nd-order curve fit to the values of the gray swatches), and the small rectangle inside the inner square shows what the color should actually be, based on perfect rendering to the sRGB color space. This image shows the excellent hue accuracy, as well as a gamma curve that results in a slight overexposure of bright swatches, and an underexposure of darker ones. (This despite the 5D's excellent preservation of shadow detail, which we'll learn more about below.)
Gray Patch Tone and Noise Analysis
There's a lot in this particular graph, a lot more than I have room to go into here. Bottom line, the Canon EOS-5D's noise levels are very low at low ISO. In comparing these graphs with those from other competing cameras, I've found that the Noise Spectrum graph at lower right is the most important. Cameras that manage to shift their noise spectrum to higher frequencies have much finer-grained noise structures, making their noise less visually objectionable. In the graph above, this would show up as a noise spectrum curve that remained higher on the right side, representing higher noise frequencies. The champion at this was the Canon EOS-1Ds Mark II, which produced remarkably fine-grained image noise, even at very high ISOs. While good, the noise spectrum of the EOS-5D is much more conventional, with more weight on the left side of the noise spectrum plot than the 1Ds managed.
Here's the same set of noise data at ISO 1600. Here, the Noise Spectrum graph is shifted a bit more toward the left-hand, lower-frequency side, making for coarser-grained image noise patterns. Once again, not bad, but falling short of the beautiful fine-grained noise patterns that the 1Ds Mark II produced. (The overall level of the noise is a bit lower in the 5D though, which helps matters somewhat.)
This chart compares the Canon EOS-5D's noise performance over a range of ISOs against that of other cameras. While I continue to show noise plots of this sort because readers ask for them, I have to again point out that the noise magnitude is only a small part of the story, the grain pattern being much more important. The bottom line really comes when you look at prints from Canon 5D images shot at ISO 1600: We were very impressed by how smooth they looked, with only a slight softening of details betraying the operation of the camera's anti-noise processing. Prints from ISO 1600 shots as large as 13 x 19 inches really looked surprisingly good. While chroma noise was clearly evident under close inspection, many users will doubtless find them entirely suitable for wall display. Shots at ISO 3200 were noticeably rougher, with the chroma noise much more obvious. Still, they looked surprisingly good at a viewing distance of a couple of feet, as they would commonly be seen on a wall. All that said though, the EOS-1Ds Mark II remains the high-ISO noise champ, thanks to its exceptionally fine-grained noise pattern.
Dynamic Range Analysis
A key parameter in a digital camera is its Dynamic Range, the range of brightness that can be faithfully recorded. At the upper end of the tonal scale, dynamic range is dictated by the point at which the RGB data "saturates" at values of 255, 255, 255. At the lower end of the tonal scale, dynamic range is determined by the point at which there ceases to be any useful difference between adjacent tonal steps. Note the use of the qualifier "useful" in there: While it's tempting to evaluate dynamic range as the maximum number of tonal steps that can be discerned at all, that measure of dynamic range has very little relevance to real-world photography. What we care about as photographers is how much detail we can pull out of the shadows before image noise becomes too objectionable. This, of course, is a very subjective matter, and will vary with the application and even the subject matter in question. (Noise will be much more visible in subjects with large areas of flat tints and subtle shading than it would in subjects with strong, highly contrasting surface texture.)
What makes most sense then, is to specify useful dynamic range in terms of the point at which image noise reaches some agreed-upon threshold. To this end, Imatest computes a number of different dynamic range measurements, based on a variety of image noise thresholds. The noise thresholds are specified in terms of f-stops of equivalent luminance variation in the final image file, and dynamic range is computed for noise thresholds of 1.0 (low image quality), 0.5 (medium image quality), 0.25 (medium-high image quality) and 0.1 (high image quality). For most photographers and most applications, the noise thresholds of 0.5 and 0.25 f-stops are probably the most relevant to the production of acceptable-quality finished images, but many noise-sensitive shooters will insist on the 0.1 f-stop limit for their most critical work.
The image below shows the test results from Imatest for the EOS-5D with a nominally-exposed density step target (Stouffer 4110), using the 5D's "Standard" Picture Style.
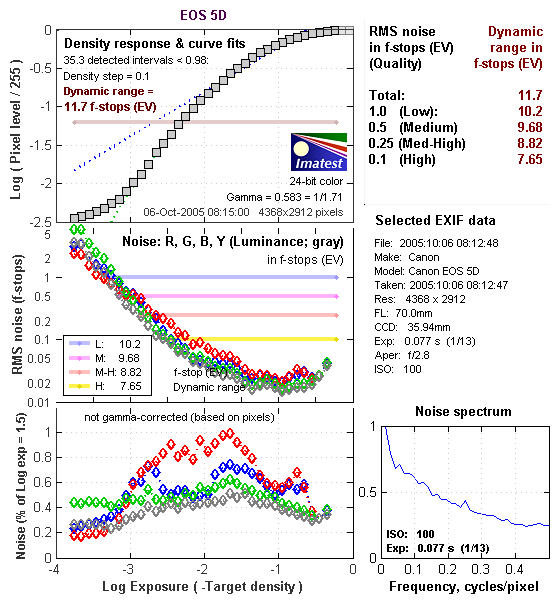
These are excellent numbers, particularly coming straight from the camera as a JPEG. What I particularly like about the above data though is the very nice "S" shape to the density curve. The Canon 5D's tonal response looks very much like film in this respect, with a nice gentle tail at each end of its tone curve. Let's also look at how the EOS-5D's images behave when processed from the RAW format.
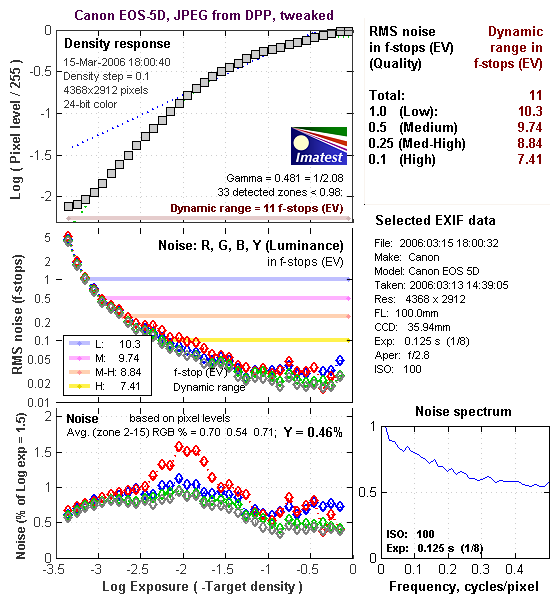
The plots above show the results of a somewhat more overexposed frame, shot to give the RAW processing software more overexposed density steps on the highlight end to play with. These steps show in the JPEG files as completely blown out to white, but cameras often have a little headroom for highlights in their RAW files that some RAW processing software can pull back. In contrast, the camera itself seemed to do about 0.2 stops better when the lightest step was just shy of blowing out.) The results above were obtained after processing a CR2 RAW file through Digital Photo Professional 2.0, and tweaking the controls to produce a final image that just barely revealed all the image data shown in the DPP histogram displays within the available tonal range.
Interestingly, DPP doesn't extract quite as much dynamic range from the CR2 file as the camera itself manages in the JPEG. In particular, no highlight detail appeared that wasn't already present in the original JPEG, no matter how I contorted the tone curve in DPP.
What's interesting about the above data though, is the Noise Spectrum plot in the lower right. Compare it to the same plot in the results for the camera JPEG above. See how relatively high and flat it is on the right-hand side? That's because the image noise in the DPP sample is much finer-grained than that from the camera itself. We'll look into that a bit further down.
What about Adobe Camera Raw (ACR) though?
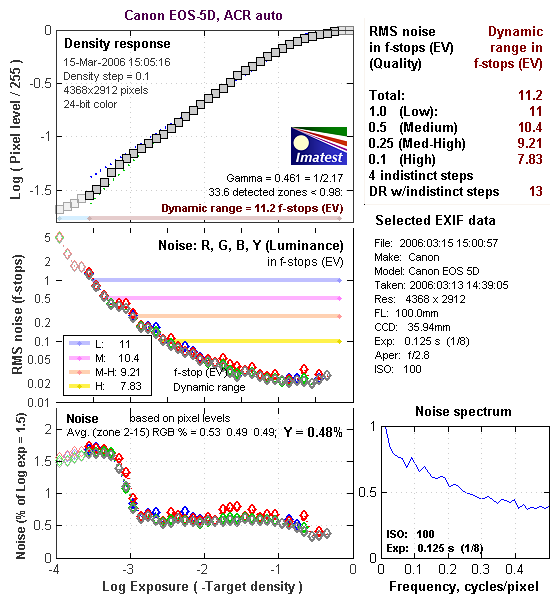
Using its automatic settings (which in my experience have generally worked best for dynamic range tests like this), ACR managed to extract about a third of a stop more dynamic range from the CR2 file at the highest quality level, but did quite well when indistinct steps in the greyscale were considered. In particular, it managed to recover upwards of a full stop more detail in highlights that were totally blown out in the Camera JPEG or DPP-derived image. I played a bit with the controls in Adobe Camera Raw, but no setting did much better than ACR did on its own. (I managed to get a bit smoother tone curve, and a bit more detail revealed in the shadows, but at the cost of a little bit of data in the highlights.) Here again though, the Noise Spectrum plot reveals that the noise from ACR is a bit finer-grained than in JPEGs straight from the camera.
Let's take a look at some crops from the test images, to see what the noise patterns look like from the three sources (camera, ACR, DPP):
| From Camera | From ACR | From DPP |
 |
 |
 |
 |
 |
 |
| (Same shots as above, but brightened in Photoshop with the Levels tool, setting the highlight slider to 100) | ||
Here's a look at crops from the original camera JPEG, a version processed through ACR, and the one processed through DPP. What's particularly interesting is that ACR does a better job at its default noise-reduction settings of "flattening" the noise in the individual color channels than either the camera or DPP, but the image is a bit softer with the default sharpness settings. Chroma noise is considerably reduced, and the noise pattern is finer-grained than that produced by the camera, but coarser than that from DPP. DPP's noise is a bit finer-grained than that from the camera's own JPEGs, but there's arguably a bit more chroma noise. Also interesting is that the default settings of both ACR and DPP produced more neutral grey scales than did the camera.
To get some perspective, here's a summary of the EOS-5D's dynamic range performance, and how it compares to other digital SLRs that we also have Imatest dynamic range data for. (Results are arranged in order of decreasing dynamic range at the "High" quality level.):
| Dynamic Range (in f-stops) vs Image Quality (At camera's minimum ISO) |
||||
| Model | 1.0 (Low) |
0.5 (Medium) |
0.25 (Med-High) |
0.1 (High) |
| Fujifilm S3 Pro (Adobe Camera Raw 2) |
12.1 | 11.7 | 10.7 | 9.0 |
| Canon EOS-1Ds Mark II (Adobe Camera Raw 3) |
11.2 | 10.3 | 9.4 | 8.14 |
| Fujifilm S3 Pro | -- | 9.9 | 9.4 | 7.94 |
| Canon EOS-5D (Adobe Camera Raw 3) |
11.0 | 10.4 | 9.21 | 7.83 |
| Canon EOS-5D (Camera JPEG) |
10.2 | 9.68 | 8.82 | 7.65 |
| Nikon D200 (Adobe Camera Raw 3) |
10.6 | 9.65 | 8.96 | 7.61 |
| Nikon D50 | 10.7 | 9.93 | 8.70 | 7.36 |
| Canon EOS 20D | 10.3 | 9.66 | 8.85 | 7.29 |
| Canon Digital Rebel XT | 10.3 | 9.51 | 8.61 | 7.11 |
| Nikon D200 (Camera JPEG) |
-- | 9.07 | 8.36 | 7.11 |
| Olympus EVOLT | 10.8 | 9.26 | 8.48 | 7.07 |
| Canon EOS-1Ds Mark II (Camera JPEG) |
10.3 | 9.38 | 8.6 | 7.04 |
| Canon Digital Rebel | 10.1 | 9.11 | 8.47 | 6.97 |
| Pentax *istDs | 10.2 | 10 | 8.87 | 6.9 |
| Nikon D2x | -- | 8.93 | 7.75 | 6.43 |
| Nikon D70S | 9.84 | 8.69 | 7.46 | 5.85 |
| Nikon D70 | 9.81 | 8.76 | 7.58 | 5.84 |
The results shown in the table are interesting. One of the first things that struck me when I initially looked at test data for a wide range of d-SLRs, was that here again, purely analytical measurements don't necessarily correlate all that well with actual photographic experience. There's no question that the Fuji S3 Pro deserves its place atop the list, as its unique "SR" technology does indeed deliver a very obvious improvement in tonal range in the highlight portion of the tonal scale. I was surprised to see the analytical results place the Olympus EVOLT as highly as they did, given that our sense of that camera's images was that they were in fact noisier than those of many other d-SLRs that we looked at. In the other direction, I was quite surprised to see the Nikon D2x place as low on the listings as it did, given that we found that camera's shadow detail to be little short of amazing.
One thing that's going on here though, is that we tested each camera at its lowest ISO setting, which should produce best-case noise levels. This is in fact what many photographers will be most interested in, but it does perhaps place the Nikons at a disadvantage, as their lowest ISO setting is 200, as compared to the ISO 100 settings available on most other models.
Regardless of the positions of the other cameras though, it's clear from its images that the EOS-5D's noise levels are quite low, helped by its relatively large pixels, Canon's advanced CMOS sensor technology, and artful anti-noise processing in its Digic II processor.
As I always say though, at the end of the day, I think you have to take the figures here with a grain of salt, and look at actual images with your own eyes to see what you make of each camera's tonal range and noise levels. We'll continue performing these dynamic range tests on the digital SLRs that we review, but (just as with the laboratory resolution target results), we suggest that you not rely on them exclusively for making your purchase decisions.
The chart above shows consolidated results from spatial frequency response measurements in both the horizontal and vertical axes. The "MTF 50" numbers tend to correlate best with visual perceptions of sharpness, so those are what I focus on here. The uncorrected resolution figures are 1794 line widths per picture height in the horizontal direction (corresponding to the vertically-oriented edge), and 1612 along the vertical axis (corresponding to the horizontally-oriented edge), for a combined average of 1703 LW/PH. Correcting to a "standardized" sharpening with a one-pixel radius increases this number a modest amount, to an average of 1916 LW/PH. Interestingly, the 5D's unadjusted numbers are fairly close to those of the higher-resolution 1Ds Mark II, while its corrected numbers are dramatically lower. The reason for this is evident when you look at the edge profiles below, where it's obvious that the 5D does apply a modest sharpening operator to its images in its "Standard" Picture Style, whereas the 1Ds Mark II applies virtually none. As a result, the uncorrected figures for the 1Ds Mark II are artificially low. It's generally been the case that Canon is very conservative in its application of in-camera image sharpening across its entire product line, but particularly in its d-SLRs. The 5D is a bit of a departure from this, perhaps an attempt to cater more to those who want to use the JPEGs straight from the camera, with little or no post-processing.
For the real techno-geeks, the two plots below show the actual edge response of the Canon EOS-5D, for horizontal and vertical edges. Here, we can see that the camera's default sharpening does produce a slight bump in the edge profiles, in both vertical and horizontal directions. This will make its images straight from the camera look a little crisper to the eye, although it does introduce relatively slight "halo" artifacts around sharp edges.
Reader Comments! --> Visit our discussion forum for the Canon EOS-5D!

Follow Imaging Resource: