Konica Minolta Maxxum 5DQuickly on the heels of its first dSLR, Konica Minolta shrinks the form factor and the price without losing in-camera image stabilization.<<Reference: Datasheet :(Previous) | (Next): Maxxum 5D Test Images>> Maxxum 5D Imatest ResultsReview First Posted: 10/31/2005 |
Detailed analysis of the Konica Minolta Maxxum 5D images, from Imatest(tm)
I've recently begun using Norman Koren's excellent "Imatest" analysis program for quantitative, thoroughly objective analysis of digital camera test images. I highly commend it to our technically-oriented readers, as it's far and away the best, most comprehensive analysis program I've found to date.
My comments below are just brief observations of what I see in the Imatest results. A full discussion of all the data Imatest produces is really beyond the scope of this review: Visit the Imatest web site for a full discussion of what the program measures, how it performs its computations, and how to interpret its output.
Here's some of the results produced by Imatest for the Konica Minolta 5D:
Color Accuracy
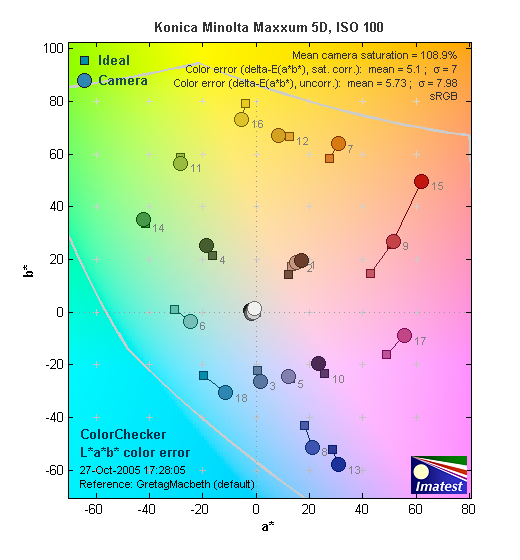
The Maxxum 5D shows generally good hue accuracy, and saturation is for the most part close to neutral. The exceptions to both conditions are the shift of cyans towards pure blue (a common tactic to produce better sky colors), and the significant oversaturation of strong reds. Most digital cameras oversaturate reds to some extent, but the 5D does so a bit more than most. People accustomed to the over-bright color of most consumer digital cameras and many digital SLRs may find the 5D's rendering of greens and yellows a little understated, but the fine-grained saturation adjustment lets you tweak the overall color to suit your personal preferences. Average saturation was 108.9% (oversaturated by 8.9%, mostly in the reds), average "delta-E" color error was 5.1, a good result. (Hue error, after correction for saturation.)
Color Analysis
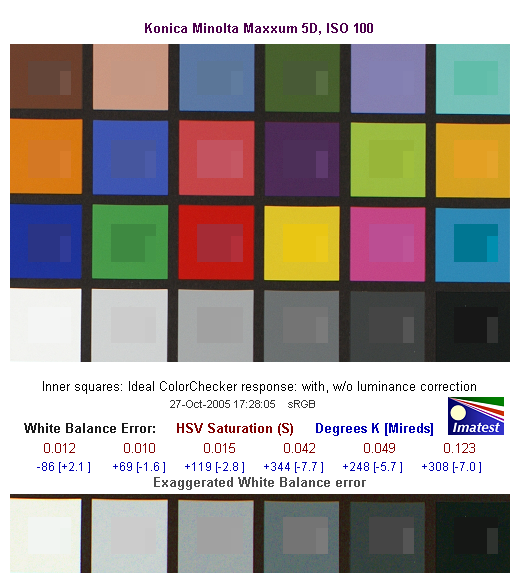
This image shows how the Konica Minolta 5D actually rendered the colors of the MacBeth chart, compared to the numerically ideal treatment. In each color swatch, the outer perimeter shows the color as actually captured by the camera, the inner square shows the color after correcting for the luminance of the photographed chart (as determined by a 2nd-order curve fit to the values of the gray swatches), and the small rectangle inside the inner square shows what the color should actually be, based on perfect rendering to the sRGB color space. This graphic shows just how bright the camera's uncorrected reds are, as well as a visible dullness in the yellows.
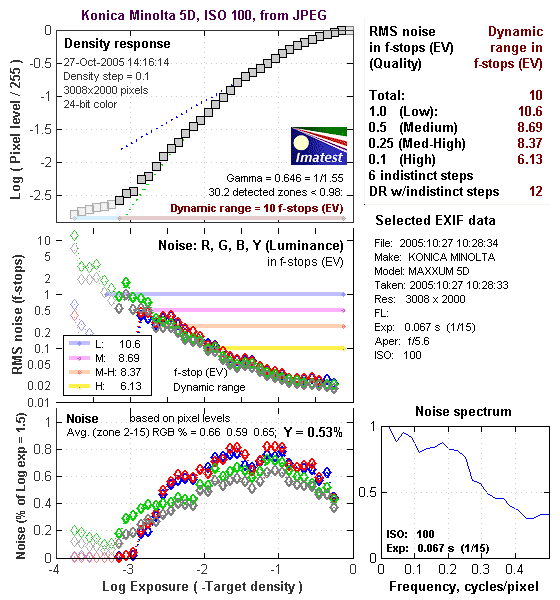
Gray Patch Tone and Noise Analysis
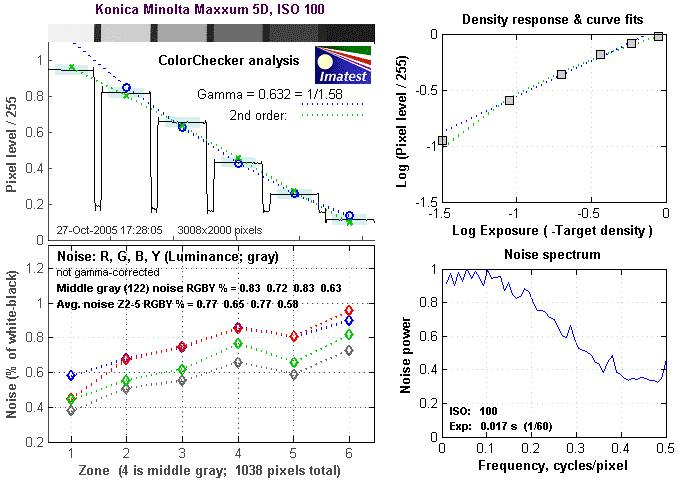
There's a lot in this particular graph, a lot more than I have room to go into here. Bottom line, the Konica Minolta's noise characteristics at low ISO settings are excellent. If you compare these graphs with those from other competing cameras, what will stand out the most is the shape of the Noise Spectrum curve in the lower right corner - At low ISOs, the 5D's noise is very fine-grained, which shows up in the Noise Spectrum plot as the rather high level of the curve at frequencies of 0.2 cycles/pixel and greater.
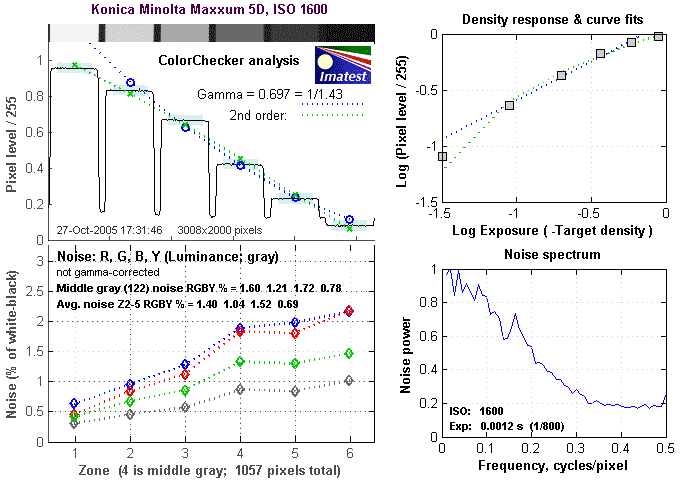
Here's the same set of noise data at ISO 1600. Regrettably, the very fine-grained nature of the 5D's image noise at low ISO gives way to a very strong low-frequency component at high ISO settings. This makes the 5D's high-ISO noise look much coarser, and therefore more objectionable to most viewers.
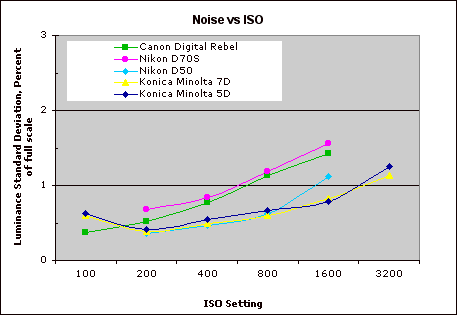
This chart compares the Konica Minolta 5D's noise performance over a range of ISOs against that of other cameras. While I continue to show noise plots of this sort because readers ask for them, I have to again point out that the noise magnitude is only a small part of the story, the grain pattern being much more important. What's interesting about this particular plot though, is how similar the curves for the Maxxum 5D and 7D are, even though the 5D's noise suppression system does a much better job of preserving fine detail at high ISO settings than the 7D's did. The 7D's progressive loss of fine detail with increasing ISO was one of the few significant objections I had to that camera. The 5D largely corrects the problem.The bottom line really comes when you look at prints from Konica Minolta 5D images shot at ISO 1600: We were very impressed by how smooth they looked, with only a slight softening of details betraying the operation of the camera's anti-noise processing. (Prints from ISO 1600 shots as large as 13 x 19 inches really looked surprisingly good.)
Dynamic Range Analysis
A key parameter in a digital camera is its Dynamic Range, the range of brightness that can be faithfully recorded. At the upper end of the tonal scale, dynamic range is dictated by the point at which the RGB data "saturates" at values of 255, 255, 255. At the lower end of the tonal scale, dynamic range is determined by the point at which there ceases to be any useful difference between adjacent tonal steps. Note the use of the qualifier "useful" in there: While it's tempting to evaluate dynamic range as the maximum number of tonal steps that can be discerned at all, that measure of dynamic range has very little relevance to real-world photography. What we care about as photographers is how much detail we can pull out of the shadows before image noise becomes too objectionable. This, of course, is a very subjective matter, and will vary with the application and even the subject matter in question. (Noise will be much more visible in subjects with large areas of flat tints and subtle shading than it would in subjects with strong, highly contrasting surface texture.)
What makes most sense then, is to specify useful dynamic range in terms of the point at which image noise reaches some agreed-upon threshold. To this end, Imatest computes a number of different dynamic range measurements, based on a variety of image noise thresholds. The noise thresholds are specified in terms of f-stops of equivalent luminance variation in the final image file, and dynamic range is computed for noise thresholds of 1.0 (low image quality), 0.5 (medium image quality), 0.25 (medium-high image quality) and 0.1 (high image quality). For most photographers and most applications, the noise thresholds of 0.5 and 0.25 f-stops are probably the most relevant to the production of acceptable-quality finished images, but many noise-sensitive shooters will insist on the 0.1 f-stop limit for their most critical work.
The image below shows the test results from Imatest for the Konica Minolta 5D.
These results, derived from camera-created JPEGs are on the low side of the range that we've seen among the digital cameras we've tested. We've often found though, that Adobe Camera Raw (ACR) often can extract a great deal more information from blown highlights than even the manufacturer's own RAW-converter applications can. Let's look at what it did with RAW files from the Maxxum 5D:
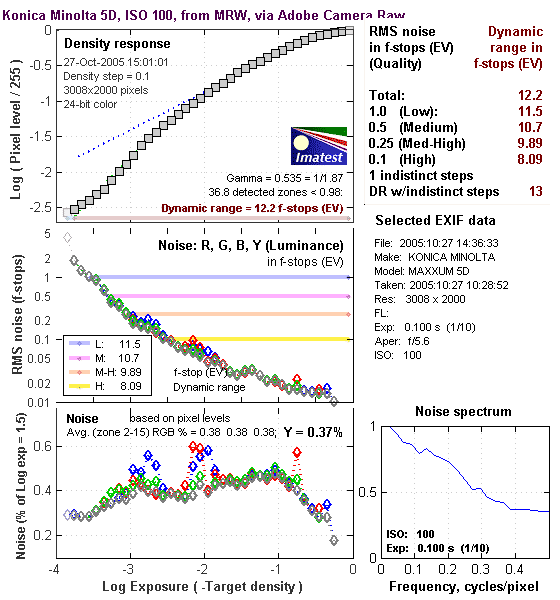
Actually, Adobe Camera Raw does even better when dealing with an intentional overexposure. The results above were measured from a density target that was exposed a full f-stop more than the one used in the previous examples. Here, ACR managed to not only pull back a full stop's worth of overexposed detail in the blown highlights, but gained almost an equal amount on the shadow end in its processing. The net result was an increase of two full stops at the highest quality level (noise level of 0.1stop), or a stop and a half at the second-highest level (noise level of 1/4 stop) relative to the dynamic range of the camera's JPEGs.
Bottom line, Adobe Camera Raw does take dramatically better advantage of the luminance information available in the 5D's RAW files.
To get some perspective, here's a summary of the Konica Minolta Maxxum 5D's dynamic range performance, and how it compares to other digital SLRs that we also have Imatest dynamic range data for. (Results are arranged in order of decreasing dynamic range at the "High" quality level.):
| Dynamic Range (in f-stops) vs Image Quality (At camera's minimum ISO) |
||||
| Model | 1.0 (Low) |
0.5 (Medium) |
0.25 (Med-High) |
0.1 (High) |
| Fujifilm S3 Pro (Via Adobe Camera Raw 2) |
12.1 | 11.7 | 10.7 | 9.0 |
| Konica Minolta Maxxum 5D (Best case Adobe Camera Raw - severe overexposure though) |
11.5 | 10.7 | 9.89 | 8.29 |
| Canon EOS-1Ds Mark II (Best case Adobe Camera Raw - severe overexposure though) |
11.2 | 10.3 | 9.4 | 8.14 |
| Fujifilm S3 Pro | -- | 9.9 | 9.4 | 7.94 |
| Nikon D50 | 10.7 | 9.93 | 8.70 | 7.36 |
| Canon EOS 20D | 10.3 | 9.66 | 8.85 | 7.29 |
| Canon Digital Rebel XT | 10.3 | 9.51 | 8.61 | 7.11 |
| Olympus EVOLT | 10.8 | 9.26 | 8.48 | 7.07 |
| Canon EOS-1Ds Mark II (Camera JPEG) |
10.3 | 9.38 | 8.6 | 7.04 |
| Canon Digital Rebel | 10.1 | 9.11 | 8.47 | 6.97 |
| Pentax *istDs | 10.2 | 10 | 8.87 | 6.9 |
| Nikon D2x | -- | 8.93 | 7.75 | 6.43 |
| Konica Minolta Maxxum 5D | 10.6 | 8.69 | 8.37 | 6.13 |
| Nikon D70S | 9.84 | 8.69 | 7.46 | 5.85 |
| Nikon D70 | 9.81 | 8.76 | 7.58 | 5.84 |
The results shown in the table are interesting. As I've said in other reviews prior this one, one of the first things that struck me when I initially looked at test data for a wide range of d-SLRs, was that here again, purely analytical measurements don't necessarily correlate all that well with actual photographic experience. There's no question that the Fuji S3 Pro deserves its place atop the list, as its unique "SR" technology does indeed deliver a very obvious improvement in tonal range in the highlight portion of the tonal scale. I was surprised to see the analytical results place the Olympus EVOLT as highly as they did, given that our sense of that camera's images was that they were in fact noisier than those of many other d-SLRs that we looked at. In the other direction, I was quite surprised to see the Nikon D2x place as low on the listings as it did, given that we found that camera's shadow detail to be little short of amazing.
One thing that's going on here though, is that we tested each camera at its lowest ISO setting, which should produce best-case noise levels. This is in fact what many photographers will be most interested in, but it does perhaps place the Nikons at a disadvantage, as their lowest ISO setting is 200, as compared to the ISO 100 settings available on most other models.
Regardless of the positions of the other cameras though, it's clear from its images that the Konica Minolta 5D's dynamic range is a bit more limited than the best d-SLRs when dealing with JPEGs straight from the camera. If you take the time to shoot in RAW mode and process the images through Adobe Camera Raw however, it can perform with the best of what's out there. (Note: We only recently added the ACR results to the table above, so we don't have that data available for d-SLRs that we tested in the past. We'll be showing both JPEG and ACR numbers for all d-SLRs going forward, but in the meantime, it's quite possible that the performance of some of the previous d-SLRs would be considerably better if their RAW files were processed through ACR also.)
As I always say though, at the end of the day, I think you have to take the figures here with a grain of salt, and look at actual images with your own eyes to see what you make of each camera's tonal range and noise levels. We'll continue performing these dynamic range tests on the digital SLRs that we review, but (just as with the laboratory resolution target results), we suggest that you not rely on them exclusively for making your purchase decisions.
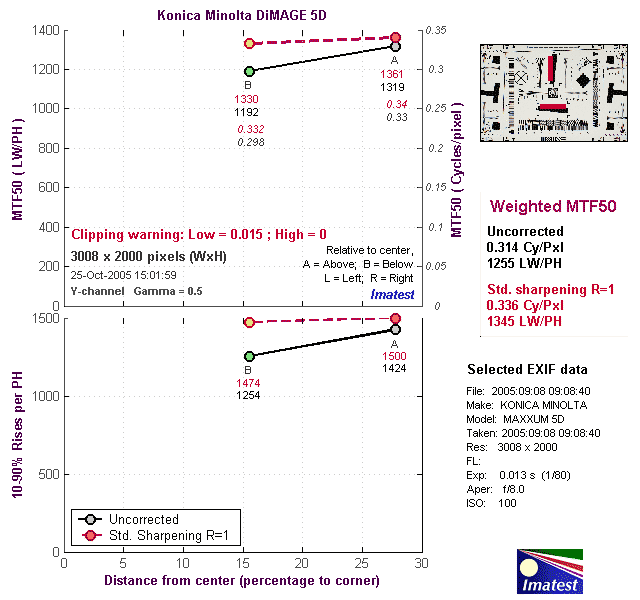
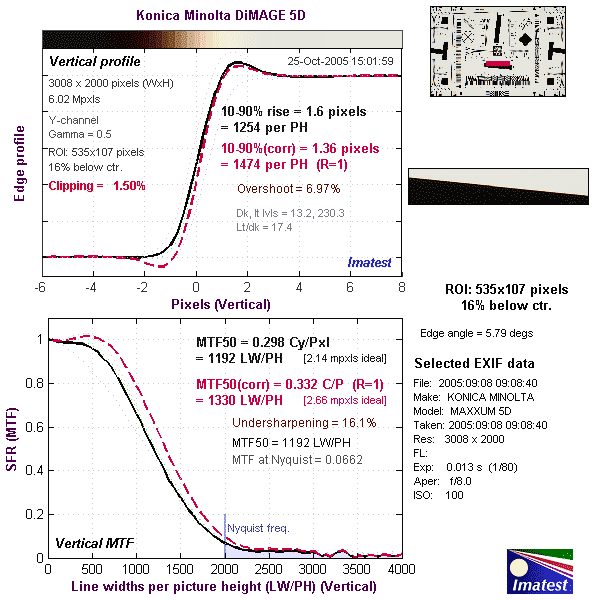
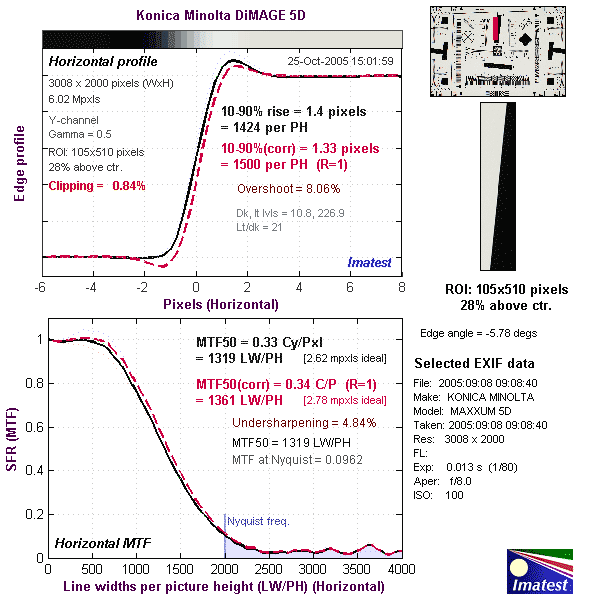
The chart above shows consolidated results from spatial frequency response measurements in both the horizontal and vertical axes. The "MTF 50" numbers tend to correlate best with visual perceptions of sharpness, so those are what I focus on here. The uncorrected resolution figures are 1319 line widths per picture height in the horizontal direction (corresponding to the vertically-oriented edge), and 1192 along the vertical axis (corresponding to the horizontally-oriented edge), for a combined average of 1255 LW/PH. Correcting to a "standardized" sharpening with a one-pixel radius increases this number only slightly, to an average of 1345 LW/PH. The relatively small gain in sharpness when the numbers are corrected implies that the Maxxum 5D's sharpening is close to optimal.
For the real techno-geeks, the two plots below show the actual edge response of the Maxxum 5D, for horizontal and vertical edges. Here, we can see that the camera's default sharpening introduces just a little bump in the luminance curve, albeit one that extends a good pixel or more away from the edge.

Follow Imaging Resource: