Fuji FinePix S3 ProFuji updates their digital SLR with a 12.34-megapixel Super CCD SR II, for amazing tonal range.<<Reference: Datasheet :(Previous) | (Next): FinePix S3 Pro Sample Images>> FinePix S3 Pro Imatest ResultsReview First Posted: 9/7/2005 |
Detailed analysis of the Fujifilm S3 Pro images, from Imatest(tm)
I've recently begun using Norman Koren's excellent "Imatest" analysis program for quantitative, thoroughly objective analysis of digicam test images. I highly commend it to our technically-oriented readers, as it's far and away the best, most comprehensive analysis program I've found to date.
My comments below are just brief observations of what I see in the Imatest results. A full discussion of all the data Imatest produces is really beyond the scope of this review: Visit the Imatest web site for a full discussion of what the program measures, how it performs its computations, and how to interpret its output.
Here's some of the results produced by Imatest for the Fujifilm S3 Pro:
Color Accuracy
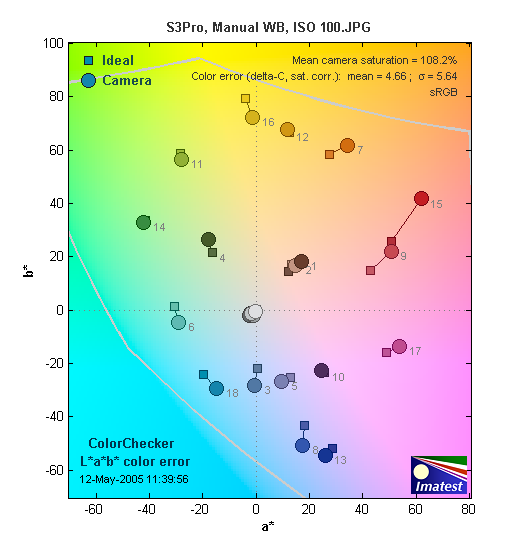
The S3 Pro showed excellent color accuracy overall. As usual with the MacBeth chart, the out-of-gamut red swatches are oversaturated. Other colors were rendered very accurately however, better than average among the other d-SLRs that I've tested. Average saturation was 108.2% (oversaturated by 8.2%, mostly in the reds), average "delta-E" color error was 5.64. (Hue error, after correction for saturation.)
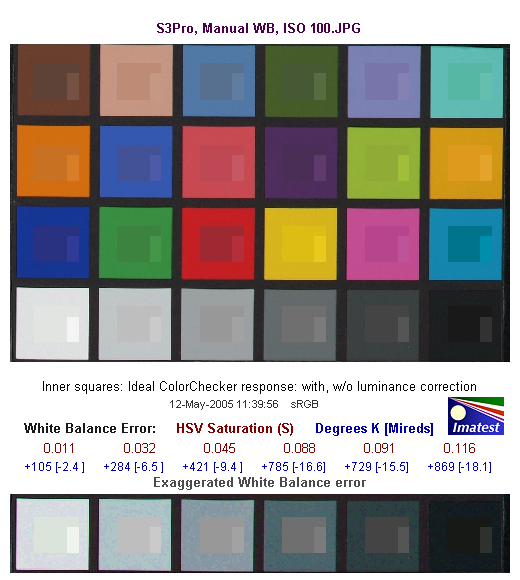
This image shows how the S3 Pro actually rendered the colors of the MacBeth chart, compared to the numerically ideal treatment. In each color swatch, the outer perimeter shows the color as actually captured by the camera, the inner square shows the color after correcting for the luminance of the photographed chart (as determined by a 2nd-order curve fit to the values of the gray swatches), and the small rectangle inside the inner square shows what the color should actually be, based on perfect rendering to the sRGB color space. The main thing that seems to be going on here is that the S3 Pro is rendering greens, browns, purples, and oranges a little darker than in real life, but with quite accurate hue and saturation.
Gray Patch Tone and Noise Analysis
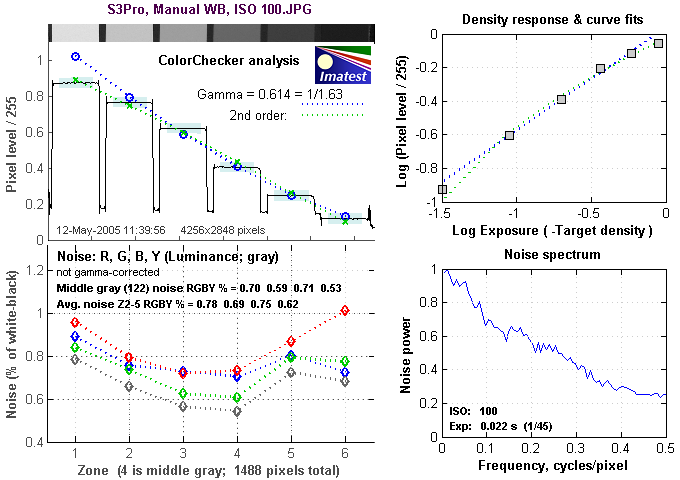
There's a lot in this particular graph, a lot more than I have room to go into here. Bottom line, the S3 Pro's noise levels are very low, although the noise spectrum is such that the noise has a coarser-grained character to it.
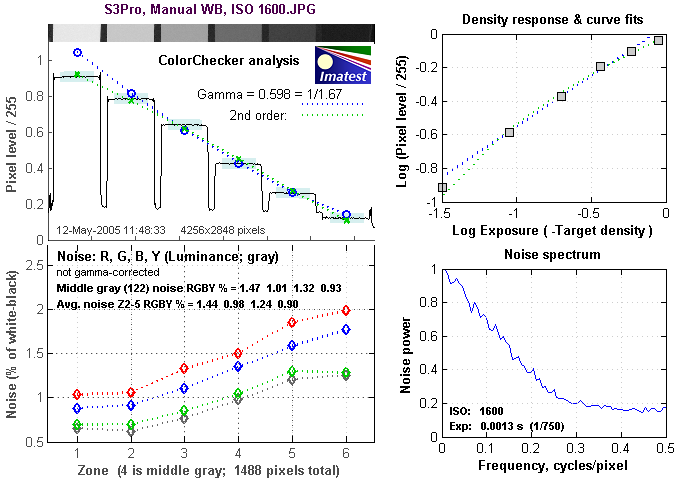
Here's the same set of noise data at ISO 1600. What's most interesting here is that the Noise Spectrum plot shows that the noise spectrum is strongly shifted toward lower spatial frequencies at high ISO. This makes for a much coarser-looking noise pattern, generally more distracting to the eye than finer-grained noise. In the case of the S3 Pro though, the magnitude of the noise is kept low enough at high ISO that the coarser-grained pattern doesn't make all that much difference.
This chart compares the S3 Pro's noise performance over a range of ISOs against that of other cameras. As you can see, the S3 Pro is competitive with most at lower ISO, but pulls away from much of the pack at high ISO levels. The Konica Minolta Maxxum 7D beats it slightly in terms of absolute noise magnitude at ISO 1600, but does so at great cost to subtle subject detail. By the same token though, the Canon EOS 20D doesn't get to quite as low an absolute noise level, but does a slightly better job at preserving fine detail than the S3 Pro does. The bottom line really comes when you look at prints from S3 Pro images shot at ISO 1600: We were very impressed by how smooth they looked, with only a relatively slight softening of details betraying the operation of the S3 Pro's anti-noise processing.
Dynamic Range Analysis
A key parameter in a digital camera is its Dynamic Range, the range of brightness that can be faithfully recorded. At the upper end of the tonal scale, dynamic range is dictated by the point at which the RGB data "saturates" at values of 255, 255, 255. At the lower end of the tonal scale, dynamic range is determined by the point at which there ceases to be any useful difference between adjacent tonal steps. Note the use of the qualifier "useful" in there: While it's tempting to evaluate dynamic range as the maximum number of tonal steps that can be discerned at all, that measure of dynamic range has very little relevance to real-world photography. What we care about as photographers is how much detail we can pull out of the shadows before image noise becomes too objectionable. This, of course, is a very subjective matter, and will vary with the application and even the subject matter in question. (Noise will be much more visible in subjects with large areas of flat tints and subtle shading than it would in subjects with strong, highly contrasting surface texture.)
What makes most sense then, is to specify useful dynamic range in terms of the point at which image noise reaches some agreed-upon threshold. To this end, Imatest computes a number of different dynamic range measurements, based on a variety of image noise thresholds. The noise thresholds are specified in terms of f-stops of equivalent luminance variation in the final image file, and dynamic range is computed for noise thresholds of 1.0 (low image quality), 0.5 (medium image quality), 0.25 (medium-high image quality) and 0.1 (high image quality). For most photographers and most applications, the noise thresholds of 0.5 and 0.25 f-stops are probably the most relevant to the production of acceptable-quality finished images, but many noise-sensitive shooters will insist on the 0.1 f-stop limit for their most critical work.
The image below shows the test results from Imatest for the Fujifilm S3 Pro, for JPEG images shot with the camera in "Wide 2" dynamic range mode.
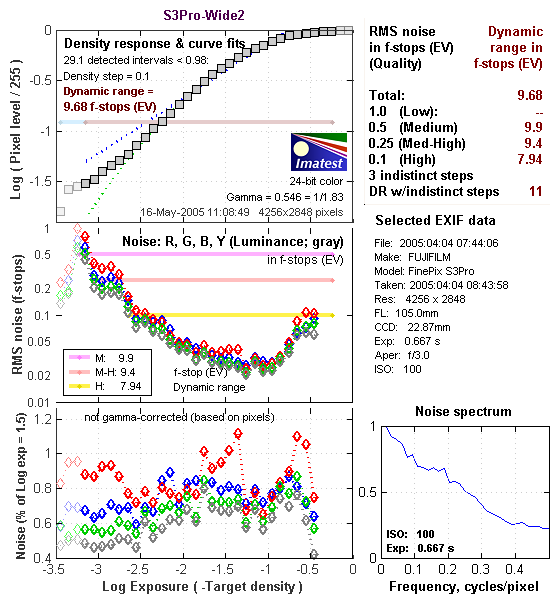
That's quite a performance, but it turns out it gets even better if you process the S3 Pro's RAF (raw format) files through Adobe's Camera Raw 2 plug-in for Photoshop:
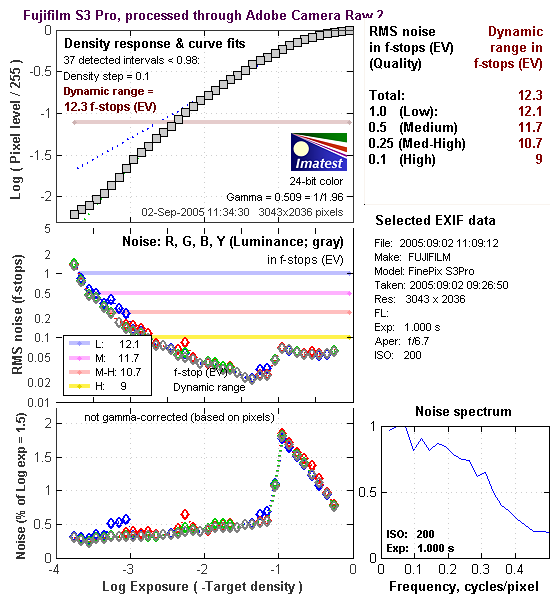
This is just flat-out amazing. To get some perspective, here's a summary of the S3 Pro's dynamic range performance, and how it compares to other digital SLRs that we also have Imatest dynamic range data for. (Results are arranged in order of decreasing dynamic range at the "High" quality level.):
| Dynamic Range (in f-stops) vs Image Quality (At camera's minimum ISO) |
||||
| Model | 1.0 (Low) |
0.5 (Medium) |
0.25 (Med-High) |
0.1 (High) |
| Fujifilm S3 Pro (Via Adobe Camera Raw 2) |
12.1 | 11.7 | 10.7 | 9.0 |
| Fujifilm S3 Pro | -- | 9.9 | 9.4 | 7.94 |
| Nikon D50 | 10.7 | 9.93 | 8.70 | 7.36 |
| Canon EOS 20D | 10.3 | 9.66 | 8.85 | 7.29 |
| Canon Digital Rebel XT | 10.3 | 9.51 | 8.61 | 7.11 |
| Olympus EVOLT | 10.8 | 9.26 | 8.48 | 7.07 |
| Canon Digital Rebel | 10.1 | 9.11 | 8.47 | 6.97 |
| Pentax *istDs | 10.2 | 10 | 8.87 | 6.9 |
| Nikon D2x | -- | 8.93 | 7.75 | 6.43 |
| Nikon D70S | 9.84 | 8.69 | 7.46 | 5.85 |
| Nikon D70 | 9.81 | 8.76 | 7.58 | 5.84 |
The results shown in the table are interesting. One of the first things that struck me when I initially looked at test data for a wide range of d-SLRs, was that here again, purely analytical measurements don't necessarily correlate all that well with actual photographic experience. There's no question that the Fuji S3 Pro deserves its place atop the list, as its unique "SR" technology does indeed deliver a very obvious improvement in tonal range in the highlight portion of the tonal scale. I was surprised to see the analytical results place the Olympus EVOLT as highly as they did, given that our sense of that camera's images was that they were in fact noisier than those of many other d-SLRs that we looked at. In the other direction, I was quite surprised to see the Nikon D2x place as low on the listings as it did, given that we found that camera's shadow detail to be little short of amazing.
One thing that's going on here though, is that we tested each camera at its lowest ISO setting, which should produce best-case noise levels. This is in fact what many photographers will be most interested in, but it does perhaps place the Nikons at a disadvantage, as their lowest ISO setting is 200, as compared to the ISO 100 settings available on most other models.
Regardless of where the other cameras fall though, it's clear that Fujifilm's "SR" sensor technology helps the S3 Pro genuinely deliver dynamic range that's at least two-thirds of a stop greater than any competing d-SLRs right from the camera. - And in real-world situations, I'd say that the effective difference is as much as a full f-stop better than the best of its competitors. When you process its RAF files through Adobe Camera Raw 2 though, the dynamic range is as much as two full f-stops greater than anything else on the market, an absolutely remarkable achievement.
Bottom line though, I think you have to take the figures here with a grain of salt, and look at actual images with your own eyes to see what you make of each camera's tonal range and noise levels. We'll continue performing these dynamic range tests on the digital SLRs that we review, but (just as with the laboratory resolution target results), we suggest that you not rely on them exclusively for making your purchase decisions.
A final caveat though, about processing the S3 Pro's image through Camera Raw 2: It does appear that this processing path introduces significant image noise in a narrow range of tonal values, near the midtone point. The crop below shows a portion of the Stouffer 4110 density wedge target, after processing through Camera Raw 2:
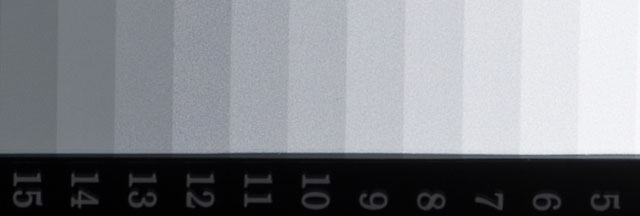
My theory about the source of this odd noise (most obvious in steps 11 and 12 above) is that it corresponds to the point at which Camera Raw is switching over from paying more attention to the S3 Pro's "R" pixels, to paying more attention to the data in the "S" (lower sensitivity) ones. Noise levels elsewhere in the tonal range are fairly normal.
The chart above shows consolidated results from spatial frequency response measurements in both the horizontal and vertical axes. The "MTF 50" numbers tend to correlate best with visual perceptions of sharpness, so those are what I focus on here. The uncorrected resolution figures are 1876 line widths per picture height in the horizontal direction (corresponding to the vertically-oriented edge), and 2001 along the vertical axis (corresponding to the horizontally-oriented edge), for a combined average of 1917 LW/PH. Correcting to a "standardized" sharpening with a one-pixel radius increases this number a lot, to an average of 2065 LW/PH. As discussed in the main review, while the S3 Pro has a total of more than 12 million photo sensors, they're arranged into a 6.45 million pixel array. (The S and R sensors don't contribute separately to resolution, since they're grouped together with each pair sharing a single microlens on the array's surface.) You'd thus expect the S3 Pro to show resolution numbers similar to those of a conventional 6-megapixel camera. In fact, the horizontal and vertical resolution are a bit higher than most 6-megapixel d-SLRs, something I've observed in the past with other cameras based on Fuji's SuperCCD technology. (Without going into all the details, there's a good explanation for this, namely that the diagonal orientation of the SuperCCD's pixels delivers slightly higher resolution along the horizontal and vertical axes. In conventional cameras with rectilinear CCD arrays, the axes of highest resolution are actually at 45 degrees to the array edges.)
For the real techno-geeks, the two plots below show the actual edge response of the S3 Pro, for horizontal and vertical edges. Here, we can see that the S3 Pro's default sharpening does actually produce slight luminance artifacts, particularly at the highlight end of the tone curve. These are slight enough that I didn't notice them visually in the S3 Pro's images, but the fact that they extend a good couple of pixels away from the edge itself is a possible explanation for the slight softness I observed in the S3 Pro's images.

Follow Imaging Resource: