Lightroom Dashboard is Google Analytics for every image you’ve ever taken
posted Wednesday, July 29, 2015 at 10:15 AM EDT

One of the most underrated aspects of digital photography is the ability to capture metadata with every single snap of the shutter. Not only does the metadata capture the shutter speed, aperture and ISO used, it also captures what lens you were using, what the focal length was and even where it was taken if your camera has GPS capabilities.
Sure, on a day-to day level, a ‘micro’ level if you will, metadata is hardly more than a means to sort through images based on the attributes mentioned above. It’s on the wider, ‘macro’ level that metadata can be used to get a more broad perspective of trends you create when capturing images.
To help you visualize that macro perspective is a free Lightroom plugin called Lightroom Dashboard. Created by an individual that simply goes by ‘Cheyne’, Lightroom Dashboard analyzes the metadata of all of your photographs and presents them in an impressive infographic, using various types of charts to map out individual data points.
No uploading of images is necessary. Simply drag and drop your catalog file onto Lightroom Dashboard’s website and the information will be sorted through.
In its current form, Lightroom Dashboard displays the following information:
- Shutter speed usage
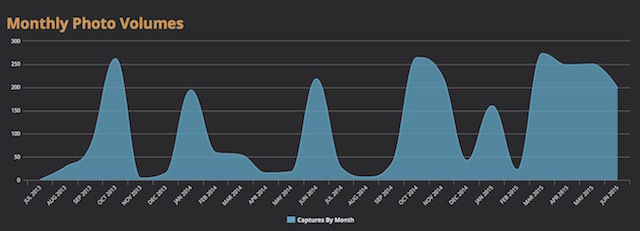
- Photo volume by month
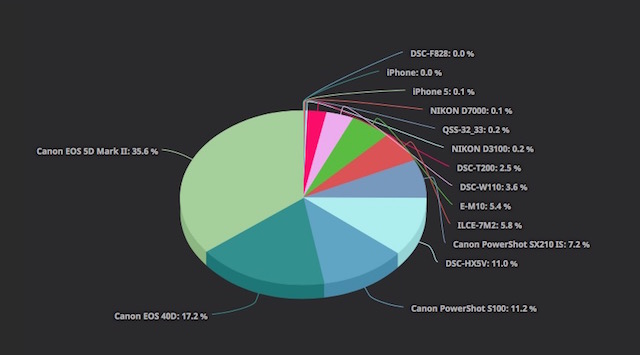
- Camera usage
- ISO usage
- Lens Usage
- Aperture usage
- Focal length usage
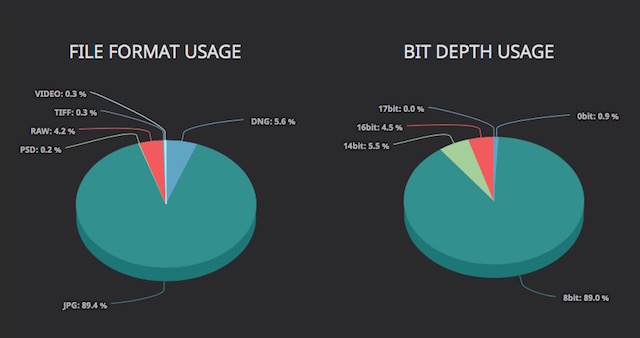
- File format usage
- Bit Depth usage
- Resolution usage
At some level, Lightroom Dashboard is nothing more than a novelty, but as we capture more and more images, being able to get a wider perspective of how we shoot will be an important tool in making decisions, especially when it comes to purchasing gear.
‘Cheyne’, the developer of the plugin, says the app will continue to be updated with more data points and features. You can keep up with the updates by following Lightroom Dashboard on Twitter.
(via thenakedcamera)