Canon EOS-1Ds Mark IICanon upgrades their "ultimate" d-SLR with 16.7 megapixels of resolution and significant performance improvements.<<Reference: Datasheet :(Previous) | (Next): EOS-1Ds Mark II Test Images>> EOS-1Ds Mark II Imatest ResultsReview First Posted: 9/26/2005 |
Detailed analysis of the Canon EOS-1Ds Mark II images, from Imatest(tm)
I've recently begun using Norman Koren's excellent "Imatest" analysis program for quantitative, thoroughly objective analysis of digicam test images. I highly commend it to our technically-oriented readers, as it's far and away the best, most comprehensive analysis program I've found to date.
My comments below are just brief observations of what I see in the Imatest results. A full discussion of all the data Imatest produces is really beyond the scope of this review: Visit the Imatest web site for a full discussion of what the program measures, how it performs its computations, and how to interpret its output.
Here's some of the results produced by Imatest for the Canon EOS-1Ds Mark II:
Color Accuracy
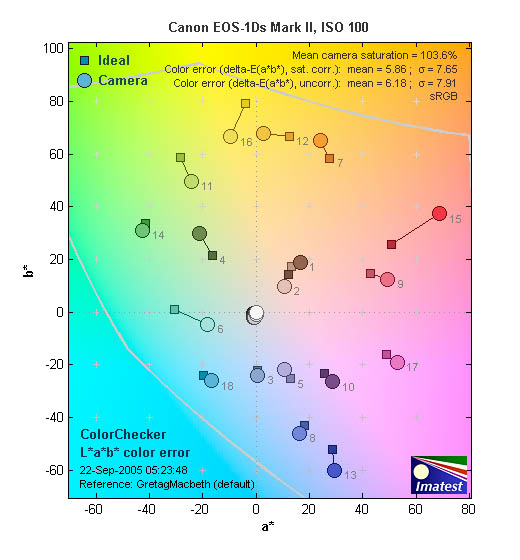
The 1Ds Mark II shows generally good hue accuracy, but saturation is a little odd: Reds are a bit hot (as usual with this target), cyans are shifted toward blue (also typical, helps sky colors), but yellows and yellow-greens are undersaturated, pure greens are a bit oversaturated. Overall color accuracy is very good to excellent, but yellows look slightly dull to the eye. Average saturation was 103.6% (oversaturated by 3.6%, mostly in the reds), average "delta-E" color error was 5.86. (Hue error, after correction for saturation.)
Color Analysis
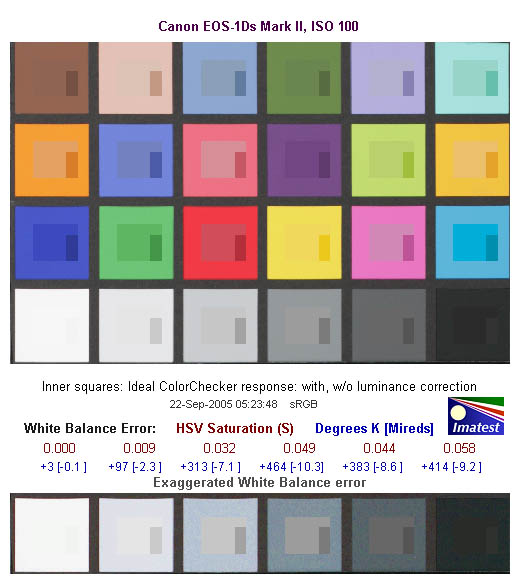
This image shows how the 1Ds Mark II actually rendered the colors of the MacBeth chart, compared to the numerically ideal treatment. In each color swatch, the outer perimeter shows the color as actually captured by the camera, the inner square shows the color after correcting for the luminance of the photographed chart (as determined by a 2nd-order curve fit to the values of the gray swatches), and the small rectangle inside the inner square shows what the color should actually be, based on perfect rendering to the sRGB color space. The camera overexposed the target by a third of a stop or so, so all the swatches are lighter than their ideal values, but the hue and saturation visual variances are in line with the numeric results shown above.
Gray Patch Tone and Noise Analysis
There's a lot in this particular graph, a lot more than I have room to go into here. Bottom line, the 1Ds Mark II's noise levels are very low. If you compare these graphs with those from other competing cameras though, what will stand out the most is the shape of the Noise Spectrum curve in the lower right corner - The 1Ds Mark II's noise is unusually fine-grained, which shows up in the Noise Spectrum plot as the very flat profile at frequencies of 0.2 cycles/pixel and greater.
Here's the same set of noise data at ISO 1600. Here again, the Noise Spectrum plot shows a lot of high-frequency content, making for an unusually fine-grained noise pattern that is much less visually obtrusive than the larger, more blotchy-looking noise that's more common inn digital cameras.
This chart compares the 1Ds Mark II's noise performance over a range of ISOs against that of other cameras. While I continue to show noise plots of this sort because readers ask for them, I have to again point out that the noise magnitude is only a small part of the story, the grain pattern being much more important. The bottom line really comes when you look at prints from 1Ds Mark II images shot at ISO 1600: We were very impressed by how smooth they looked, with only a slight softening of details betraying the operation of the camera's anti-noise processing. (Prints from ISO 1600 shots as large as 13 x 19 inches really looked surprisingly good.)
Dynamic Range Analysis
A key parameter in a digital camera is its Dynamic Range, the range of brightness that can be faithfully recorded. At the upper end of the tonal scale, dynamic range is dictated by the point at which the RGB data "saturates" at values of 255, 255, 255. At the lower end of the tonal scale, dynamic range is determined by the point at which there ceases to be any useful difference between adjacent tonal steps. Note the use of the qualifier "useful" in there: While it's tempting to evaluate dynamic range as the maximum number of tonal steps that can be discerned at all, that measure of dynamic range has very little relevance to real-world photography. What we care about as photographers is how much detail we can pull out of the shadows before image noise becomes too objectionable. This, of course, is a very subjective matter, and will vary with the application and even the subject matter in question. (Noise will be much more visible in subjects with large areas of flat tints and subtle shading than it would in subjects with strong, highly contrasting surface texture.)
What makes most sense then, is to specify useful dynamic range in terms of the point at which image noise reaches some agreed-upon threshold. To this end, Imatest computes a number of different dynamic range measurements, based on a variety of image noise thresholds. The noise thresholds are specified in terms of f-stops of equivalent luminance variation in the final image file, and dynamic range is computed for noise thresholds of 1.0 (low image quality), 0.5 (medium image quality), 0.25 (medium-high image quality) and 0.1 (high image quality). For most photographers and most applications, the noise thresholds of 0.5 and 0.25 f-stops are probably the most relevant to the production of acceptable-quality finished images, but many noise-sensitive shooters will insist on the 0.1 f-stop limit for their most critical work.
The image below shows the test results from Imatest for the EOS-1Ds Mark II.
These are good numbers, but as we'll see below, they're actually about in the middle of the range among the d-SLRs I've tested. Let's also look at how the 1Ds Mark II's images behave when processed from the RAW format...
The plots above show the results of the same exposure, only processed from the CR2 RAW file, through Digital Photo Professional 1.5. (This is a case where the 1Ds Mark II's ability to save both a RAW and JPEG file from the same shot comes in handy.) Interestingly, DPP doesn't extract as much dynamic range from the CR2 file as the camera itself manages in the JPEG. The data above was collected from a JPEG image processed with DPP's "as shot" defaults, but I found that no matter how I contorted the tone curve in DPP (cutting contrast, playing with exposure adjustment), I never did any better than the dynamic range levels shown above.
What about Adobe Camera Raw (ACR) though?
Using its automatic settings (which in my experience have generally worked best for dynamic range tests like this), ACR did manage to extract about a half-stop more dynamic range from the CR2 file, but the noise characteristics are quite different: Look at the Noise Spectrum plot in the data above, and notice how the curve is rather lumped up on the left.
Actually, Adobe Camera Raw does even better when dealing with an intentional overexposure. The results above were measured from a density target that was exposed a full f-stop more than the one used in the previous examples. Here, ACR managed to pull back a full stop's worth of overexposed detail in the blown highlights, but lost about a third of a stop on the shadow end in its processing. The net result though, was an increase of two-thirds of a stop over its own performance at the lower exposure level, and more than an f-stop relative to the dynamic range of the camera's JPEGs.
| From Camera | From ACR | From DPP |
 |
 |
 |
 |
 |
 |
| (Same shots as above, but brightened in Photoshop with the Levels tool, setting the highlight slider to 130) | ||
Here's a look at crops from the original camera JPEG, a version processed through ACR, and the one processed through DPP. What's particularly interesting is that ACR does a better job of "flattening" the noise in the individual color channels than either the camera or DPP, but the net result is still a little blotchy-looking. - The magnitude of the noise has been considerably reduced, but the grain pattern is coarser. DPP seems to go the other direction, not flattening the noise as much, but producing a very fine grain pattern.
Bottom line, Adobe Camera Raw does take better advantage of the luminance information available in the 1Ds Mark II's CR2 RAW files, but the character of the noise is changed quite a bit in the process. I do suspect that most photographers would prefer the "look" of the ACR-processed images.
To get some perspective, here's a summary of the1Ds Mark II's dynamic range performance, and how it compares to other digital SLRs that we also have Imatest dynamic range data for. (Results are arranged in order of decreasing dynamic range at the "High" quality level.):
| Dynamic Range (in f-stops) vs Image Quality (At camera's minimum ISO) |
||||
| Model | 1.0 (Low) |
0.5 (Medium) |
0.25 (Med-High) |
0.1 (High) |
| Fujifilm S3 Pro (Via Adobe Camera Raw 2) |
12.1 | 11.7 | 10.7 | 9.0 |
| Canon EOS-1Ds Mark II (Best case Adobe Camera Raw - severe overexposure though) |
11.2 | 10.3 | 9.4 | 8.14 |
| Fujifilm S3 Pro | -- | 9.9 | 9.4 | 7.94 |
| Nikon D50 | 10.7 | 9.93 | 8.70 | 7.36 |
| Canon EOS 20D | 10.3 | 9.66 | 8.85 | 7.29 |
| Canon Digital Rebel XT | 10.3 | 9.51 | 8.61 | 7.11 |
| Olympus EVOLT | 10.8 | 9.26 | 8.48 | 7.07 |
| Canon EOS-1Ds Mark II (Camera JPEG) |
10.3 | 9.38 | 8.6 | 7.04 |
| Canon Digital Rebel | 10.1 | 9.11 | 8.47 | 6.97 |
| Pentax *istDs | 10.2 | 10 | 8.87 | 6.9 |
| Nikon D2x | -- | 8.93 | 7.75 | 6.43 |
| Nikon D70S | 9.84 | 8.69 | 7.46 | 5.85 |
| Nikon D70 | 9.81 | 8.76 | 7.58 | 5.84 |
The results shown in the table are interesting. One of the first things that struck me when I initially looked at test data for a wide range of d-SLRs, was that here again, purely analytical measurements don't necessarily correlate all that well with actual photographic experience. There's no question that the Fuji S3 Pro deserves its place atop the list, as its unique "SR" technology does indeed deliver a very obvious improvement in tonal range in the highlight portion of the tonal scale. I was surprised to see the analytical results place the Olympus EVOLT as highly as they did, given that our sense of that camera's images was that they were in fact noisier than those of many other d-SLRs that we looked at. In the other direction, I was quite surprised to see the Nikon D2x place as low on the listings as it did, given that we found that camera's shadow detail to be little short of amazing.
One thing that's going on here though, is that we tested each camera at its lowest ISO setting, which should produce best-case noise levels. This is in fact what many photographers will be most interested in, but it does perhaps place the Nikons at a disadvantage, as their lowest ISO setting is 200, as compared to the ISO 100 settings available on most other models.
Regardless of the positions of the other cameras though, it's clear from its images that the EOS-1Ds Mark II's noise levels are quite low, helped by its relatively large pixels, Canon's advanced CMOS sensor technology, and artful anti-noise processing in its Digic II processor.
As I always say though, at the end of the day, I think you have to take the figures here with a grain of salt, and look at actual images with your own eyes to see what you make of each camera's tonal range and noise levels. We'll continue performing these dynamic range tests on the digital SLRs that we review, but (just as with the laboratory resolution target results), we suggest that you not rely on them exclusively for making your purchase decisions.
The chart above shows consolidated results from spatial frequency response measurements in both the horizontal and vertical axes. The "MTF 50" numbers tend to correlate best with visual perceptions of sharpness, so those are what I focus on here. The uncorrected resolution figures are 1938 line widths per picture height in the horizontal direction (corresponding to the vertically-oriented edge), and 1630 along the vertical axis (corresponding to the horizontally-oriented edge), for a combined average of 1784 LW/PH. Correcting to a "standardized" sharpening with a one-pixel radius increases this number a lot, to an average of 2997 LW/PH. The relatively low (for the camera's megapixel count) uncorrected numbers and the large jump when corrected for standard sharpening point to very conservative in-camera sharpening, a characteristic of Canon SLRs.
For the real techno-geeks, the two plots below show the actual edge response of the 1Ds Mark II, for horizontal and vertical edges. Here, we can see that the camera's default sharpening is indeed extremely conservative, as the edge profiles have very smooth, rounded corners on them. This means that the 1Ds Mark II is introducing no artifacts of its own into scene details, leaving a very clean image for subsequent processing in Photoshop or other imaging software.

Follow Imaging Resource: