Pentax K-100D Imatest Results
We routinely Norman Koren's excellent "Imatest" analysis program for quantitative, thoroughly objective analysis of digicam test images. I highly commend it to our technically-oriented readers, as it's far and away the best, most comprehensive analysis program I've found to date.
My comments below are just brief observations of what we see in the Imatest results. A full discussion of all the data Imatest produces is really beyond the scope of this review: Visit the Imatest web site for a full discussion of what the program measures, how it performs its computations, and how to interpret its output.
Here's some of the results produced by Imatest for the Pentax K-100D:
Color Accuracy
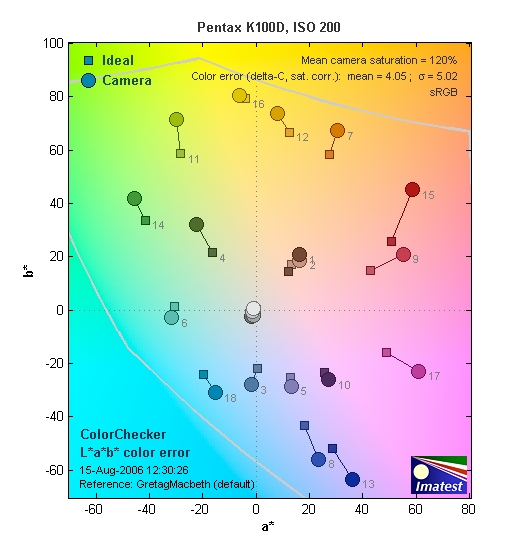
The Pentax K-100D showed really excellent hue accuracy (hue is what color the colors are), but oversaturated most colors quite a bit. (Saturation is how intense or "bright" the colors are.) Most cameras designed for consumers produce oversaturated color, simply because that's the kind of color most consumers like. The K-100D shows a very high average saturation of 120% (20% brighter than real life), but what's interesting is that the high average saturation figure is the result of most colors being a little oversaturated, rather than one or two colors being oversaturated a lot. (A lot of cameras really blast reds and blues, but leave other colors more dull looking. The overall effect on the K-100D is that its images look bright and colorful, without any one color being too blown out. - And as mentioned, its color is exceptionally hue-accurate, with an average color error (saturation corrected) of only 4.05 delta-E units. - That's close to if not the most accurate hue rendering we've seen yet in a digital camera.
Color Analysis
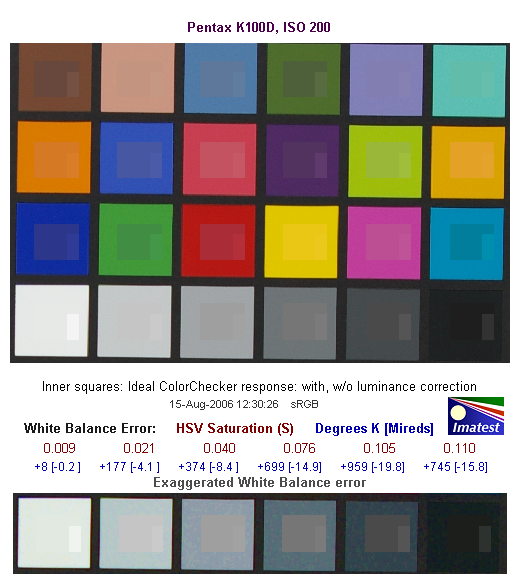
This image shows how the Pentax K-100D actually rendered the colors of the MacBeth chart, compared to a numerically ideal treatment. (Apologies for the tilt, the MacBeth chart on our Multi target had slipped slightly in these shots.) In each color swatch, the outer perimeter shows the color as actually captured by the camera, the inner square shows the color after correcting for the luminance of the photographed chart (as determined by a 2nd-order curve fit to the values of the gray swatches), and the small rectangle inside the inner square shows what the color should actually be, based on perfect rendering in the sRGB color space. This image shows the excellent hue accuracy, as well as a gamma curve that doesn't artificially boost the brightness of strong colors the way many cameras do. Very nice!
Gray Patch Tone and Noise Analysis
As always, there's a lot in this particular graph, a lot more than we have room to go into here. Bottom line, the Pentax K-100D's noise levels are moderate at low ISO, and the frequency spectrum (the graph at lower right) favors middle-to-high frequencies a bit, but has a large component at very low frequency. This means that the noise will tend to produce a blotchy look to the images, rather than having a fine, grain-like appearance. Fortunately, at low ISOs (ISO 200 is the lowest the K-100D goes), the noise levels are low enough that the blotchiness isn't really visible.
Here's the same set of noise data at ISO 1600. Here, the peak near zero frequency is gone, replaced by a relatively smooth (relative being the operative word here, most camera noise has jagged spectrum plots such as we see here) falloff as you move toward higher frequencies. The curve stays a bit higher than average in the range from 0.1 - 0.2 cycles/pixel, and is higher all the way out to 0.5 cycles/pixel. this indicates that the K-100D's image noise has plenty of high-frequency content, which contributes to the surprisingly smooth look of its ISO 1600 images.
Here's the same set of noise data at ISO 3200. Here, the Noise Spectrum graph has a radically different shape, but the overall level of the noise doesn't increase too dramatically above that at ISO 1600. The spectrum plot is all lumped up on the left side of the plot, meaning that the anti-noise processing has really hammered the fine-grained components. This is easily seen in the images, which have a very soft look to them. We were surprised though, by how good the K-100D's ISO 3200 images looked when printed, even at 8x10 inch sizes. They were definitely noisy, but viewed at arm's length (as most photos on a shelf, table, or wall most commonly are), they looked surprisingly decent.
This chart compares the Pentax K-100D's noise performance over a range of ISOs against that of other cameras. While I continue to show noise plots of this sort because readers ask for them, I each time point out that the noise magnitude is only a small part of the story, the grain pattern being much more important. There's also the matter of how much subtle subject detail is traded away in pursuit of low noise figures. In the case of the Pentax K-100D, while it actually does very well in terms of both noise level and noise grain size, it does trade away some subject detail to achieve those results.
Dynamic Range Analysis
A key parameter in a digital camera is its Dynamic Range, the range of brightness that can be faithfully recorded. At the upper end of the tonal scale, dynamic range is dictated by the point at which the RGB data "saturates" at values of 255, 255, 255. At the lower end of the tonal scale, dynamic range is determined by the point at which there ceases to be any useful difference between adjacent tonal steps. Note the use of the qualifier "useful" in there: While it's tempting to evaluate dynamic range as the maximum number of tonal steps that can be discerned at all, that measure of dynamic range has very little relevance to real-world photography. What we care about as photographers is how much detail we can pull out of the shadows before image noise becomes too objectionable. This, of course, is a very subjective matter, and will vary with the application and even the subject matter in question. (Noise will be much more visible in subjects with large areas of flat tints and subtle shading than it would in subjects with strong, highly contrasting surface texture.)
What makes most sense then, is to specify useful dynamic range in terms of the point at which image noise reaches some agreed-upon threshold. To this end, Imatest computes a number of different dynamic range measurements, based on a variety of image noise thresholds. The noise thresholds are specified in terms of f-stops of equivalent luminance variation in the final image file, and dynamic range is computed for noise thresholds of 1.0 (low image quality), 0.5 (medium image quality), 0.25 (medium-high image quality) and 0.1 (high image quality). For most photographers and most applications, the noise thresholds of 0.5 and 0.25 f-stops are probably the most relevant to the production of acceptable-quality finished images, but many noise-sensitive shooters will insist on the 0.1 f-stop limit for their most critical work.
The image below shows the test results from Imatest for an in-camera JPEG file from the Pentax K-100D with a nominally-exposed density step target (Stouffer 4110), with the contrast setting at its default position.
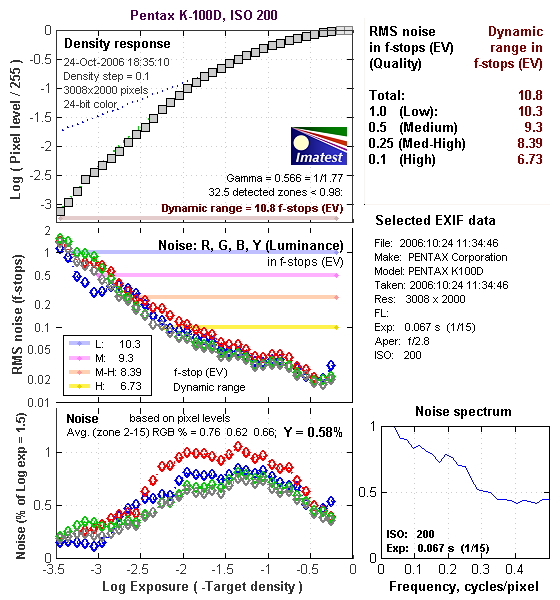
Straight from the camera, the K-100D's JPEG images have a smaller than average dynamic range if you limit yourself to the very best quality criteria, a maximum noise level of 0.1 EV. This is likely caused in part by the K-100D's minimum ISO of 200, as the resulting higher noise level makes it harder to achieve the 0.1 EV noise threshold. Dropping down to the 0.25 EV noise threshold greatly improves results though, bringing its performance more on par with the general run of DSLRs we've tested.
More significant than the absolute dynamic range is the shape of the density response curve, and how smoothly it transitions from highlight to midtone to shadow. The K-100D has a nice gradual curve at the highlight end, meaning it maintains relatively good gradation in highlight areas. At the left (shadow) end of the curve though, its more linear response means the shadows are more likely to become quantized and blocky-looking as you try to bring detail up out of them.
That's the story with JPEG files created in the camera, how about in an external RAW converter, such as Adobe Camera Raw (ACR)?
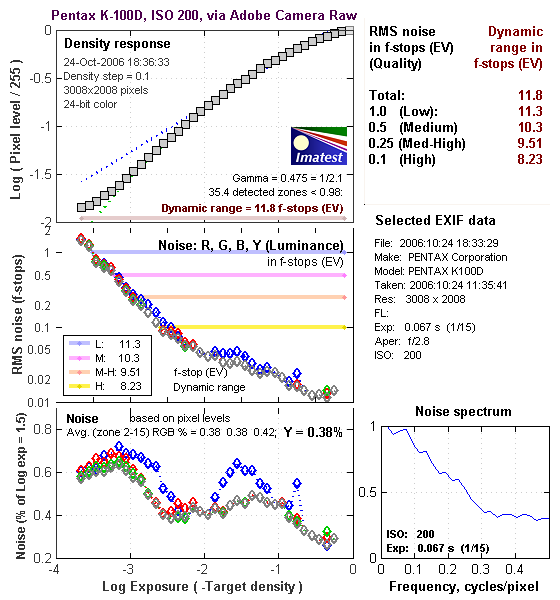
Wow! Using its automatic settings (which in my experience has generally worked best for dynamic range tests like this), ACR managed to extract a full stop and a half (!) more dynamic range at the highest quality level, and a full stop or more at all other noise threshold values. Some of this is due to ACR's excellent noise processing, and some appears to be due to the K-100D's good highlight headroom in its RAW files.
Dynamic Range, the bottom line:
So what can we conclude about the K-100D's dynamic range? I think two things: First, that the K-100D's internal JPEG output results in somewhat limited dynamic range at the highest quality level, apparently the result of its higher than average minimum ISO and the noise levels that result. The big (!) surprise is its RAW file quality, and how much tonality Adobe Camera Raw can pull out of its RAW files. Very impressive, it looks to us like the K-100D might have surprising appeal among RAW shooters looking for an inexpensive camera with great tonal range.
To get some perspective, here's a summary of the Pentax K-100D's dynamic range performance, and how it compares to other digital SLRs that we also have Imatest dynamic range data for. (Results are arranged in order of decreasing dynamic range at the "High" quality level.):
| Dynamic Range (in f-stops) vs Image Quality (At camera's minimum ISO) |
||||
| Model | 1.0 (Low) |
0.5 (Medium) |
0.25 (Med-High) |
0.1 (High) |
| Fujifilm S3 Pro (Adobe Camera Raw 2) |
12.1 | 11.7 | 10.7 | 9.0 |
| Pentax K-100D (Adobe Camera Raw 3.6) |
11.3 | 10.3 | 9.51 | 8.23 |
| Canon EOS-1Ds Mark II (Adobe Camera Raw 3) |
11.2 | 10.3 | 9.4 | 8.14 |
| Fujifilm S3 Pro | -- | 9.9 | 9.4 | 7.94 |
| Canon Digital Rebel XTi (Adobe Camera Raw 3.6) |
10.8 | 9.88 | 9.18 | 7.84 |
| Canon EOS-5D (Adobe Camera Raw 3) |
11.0 | 10.4 | 9.21 | 7.83 |
| Canon EOS-5D (Camera JPEG) |
10.2 | 9.68 | 8.82 | 7.65 |
| Nikon D200 (Adobe Camera Raw 3) |
10.6 | 9.65 | 8.96 | 7.61 |
| Nikon D80 (Adobe Camera Raw 3.6) |
11.1 | 10.4 | 9.42 | 7.51 |
| Nikon D50 | 10.7 | 9.93 | 8.70 | 7.36 |
| Canon EOS 20D | 10.3 | 9.66 | 8.85 | 7.29 |
| Nikon D80 (Camera JPEG) |
10.1 | 9.43 | 8.48 | 7.12 |
| Canon Digital Rebel XT | 10.3 | 9.51 | 8.61 | 7.11 |
| Nikon D200 (Camera JPEG) |
-- | 9.07 | 8.36 | 7.11 |
| Olympus EVOLT | 10.8 | 9.26 | 8.48 | 7.07 |
| Canon Digital Rebel XTi (Camera JPEG) |
9.83 | 9.10 | 8.27 | 7.04 |
| Canon EOS-1Ds Mark II (Camera JPEG) |
10.3 | 9.38 | 8.6 | 7.04 |
| Canon Digital Rebel | 10.1 | 9.11 | 8.47 | 6.97 |
| Pentax *istDs | 10.2 | 10 | 8.87 | 6.9 |
| Pentax K-100D (Camera JPEG) |
10.3 | 9.3 | 8.39 | 6.73 |
| Nikon D2x | -- | 8.93 | 7.75 | 6.43 |
| Nikon D70S | 9.84 | 8.69 | 7.46 | 5.85 |
| Nikon D70 | 9.81 | 8.76 | 7.58 | 5.84 |
Standard Observations:
The results shown in the table are interesting. One of the first things that struck me when I initially looked at test data for a wide range of d-SLRs, was that here again, purely analytical measurements don't necessarily correlate all that well with actual photographic experience. There's no question that the Fuji S3 Pro deserves its place atop the list, as its unique "SR" technology does indeed deliver a very obvious improvement in tonal range in the highlight portion of the tonal scale. I was surprised to see the analytical results place the Olympus EVOLT as highly as they did, given that our sense of that camera's images was that they were in fact noisier than those of many other d-SLRs that we looked at. In the other direction, I was quite surprised to see the Nikon D2x place as low on the listings as it did, given that we found that camera's shadow detail to be little short of amazing.
One thing that's going on here though, is that we tested each camera at its lowest ISO setting, which should produce best-case noise levels. This is in fact what many photographers will be most interested in, but it does perhaps place some of the Nikons at a disadvantage, as their lowest ISO setting is 200, as compared to the ISO 100 settings available on most other models.
K-100D Specifics:
Regardless of the positions of the other cameras though, the Pentax K-100D does appear to have a good dynamic range, when its images are processed from RAW files with a good RAW converter. JPEGs straight from the camera have acceptable tonal range, but only if you're willing to tolerate slightly higher noise levels than the fussiest shooters might insist on.
As I always say though, at the end of the day, I think you have to take the figures here with a grain of salt, and look at actual images with your own eyes to see what you make of each camera's tonal range and noise levels. We'll continue performing these dynamic range tests on the digital SLRs that we review, but (just as with the laboratory resolution target results), we suggest that you not rely on them exclusively for making your purchase decisions.
The chart above shows consolidated results from spatial frequency response measurements in both the horizontal and vertical axes. The "MTF 50" numbers tend to correlate best with visual perceptions of sharpness, so those are what I focus on here. The uncorrected resolution figures are 1070 line widths per picture height horizontally and 787 lw/ph vertically. Correcting to a "standardized" sharpening with a one-pixel radius increases this number quite a bit, to an average of 1168 lw/ph. These numbers are on the low side, even for a 6-megapixel camera. (For example, the Nikon D50 showed an uncorrected resolution of 1426 lw/ph.) The K-100D appears to have a somewhat heavy-handed anti-aliasing filter and very conservative in-camera sharpening, making its images straight from the camera a little soft.
It's important though, not to place too much weight on purely analytical results of this sort. Looking at images of "real" subjects shot with the K-100D, they show plenty of fine detail, take post-capture sharpening on the computer very well, and compete well with shots from other 6-megapixel SLRs.
To see what's going on, refer to the plots below, which show the actual edge profiles for both horizontal and vertical edges, in both their original and corrected forms. These show the very gentle slope of horizontal edges, and the much steeper slope of vertical ones.
 Fujifilm GFX 50S Review
 Fujifilm X-T3 Review
 Olympus E-M5 III Review

Follow Imaging Resource