Pentax K20D Imatest Results
We routinely use Norman Koren's excellent "Imatest" analysis program for quantitative, thoroughly objective analysis of digicam test images. I highly recommend it to our technically-oriented readers, as it's far and away the best, most comprehensive analysis program I've found to date.
My comments below are just brief observations of what we see in the Imatest results. A full discussion of all the data Imatest produces is really beyond the scope of this review: Visit the Imatest web site for a full discussion of what the program measures, how it performs its computations, and how to interpret its output.
Here's some of the results produced by Imatest for the Pentax K20D:
sRGB Accuracy Comparison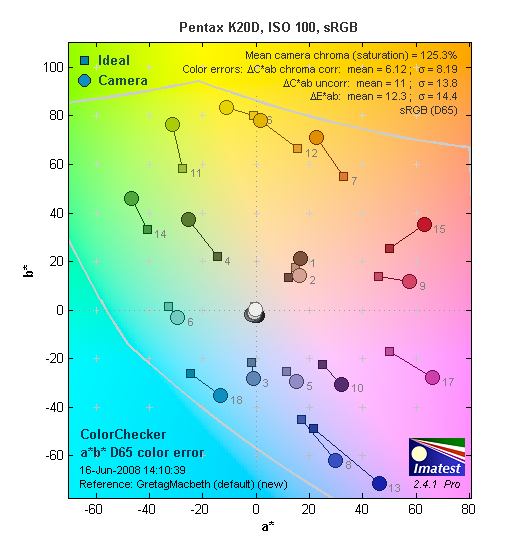 |
|||
The Pentax K20D showed fairly good color accuracy, though its average saturation is quite a bit higher than that of most competitors. Hue accuracy was good, with relatively small hue shifts occurring in many colors. Average saturation was 125.3% (25.3% oversaturated) and average "delta-C" color error was 6.1 after correction for saturation, which while not bad, isn't quite as good as some of the competition. (Delta-C is the same as the more commonly referred to delta-E, but delta-C takes into account only color differences, ignoring luminance variation.) Overall, a good (albeit vibrant) default color response for a digital SLR. Mouse over the links below the illustration above to compare results with other recent prosumer models.
Adobe RGB Accuracy Comparison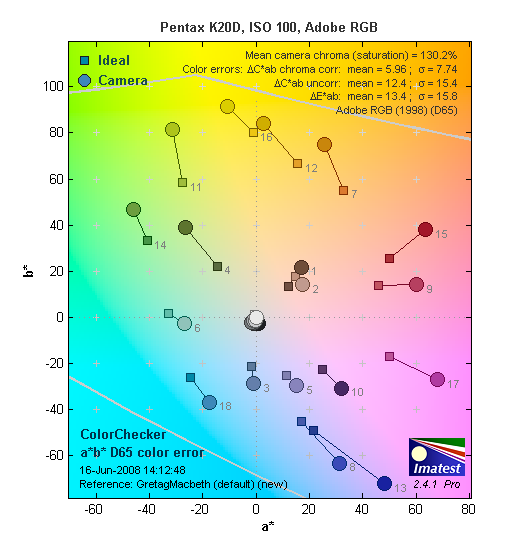 |
|||
Like most cameras, when using the Adobe RGB color space (which provides a much wider gamut, or range of colors that can be expressed), the Pentax K20D delivers even more highly saturated color, with an average saturation of 130.2% and average saturation-corrected hue error of 5.96 "delta-C" units. Again, mouse over the links below the illustration above to compare results with other recent prosumer digital SLRs.
Pentax K20D Color Analysis
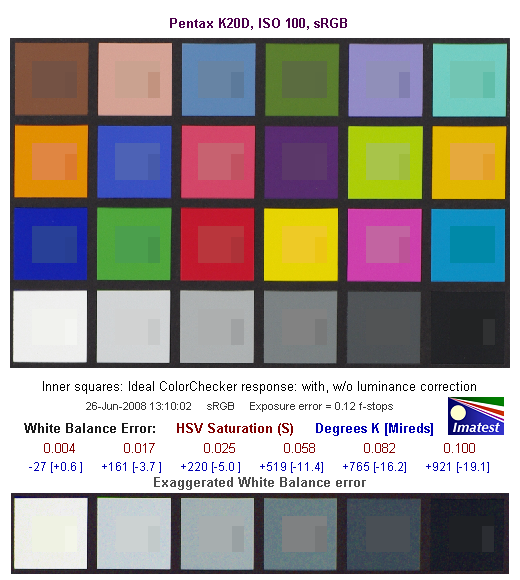
This image shows how the Pentax K20D actually rendered the colors of the MacBeth chart, compared to a numerically ideal treatment. In each color swatch, the outer perimeter shows the color as actually captured by the camera, the inner square shows the numerically ideal color, after correcting for the luminance of the photographed chart (as determined by a second-order curve fit to the values of the gray swatches), and the small rectangle inside the inner square shows the numerically ideal color, without any luminance correction. This image shows the good hue accuracy, as well as a gamma curve that results in a slight overexposure of some of the highly saturated swatches.
Pentax K20D Noise Analysis
There's a lot in this particular graph, a lot more than we have room to go into here. (This set of plots has also changed a little in the more recent versions of Imatest. Some of the plots that were shown here previously are now shown in other Imatest output. Since we largely focus on the Noise Spectrum plot, we'll only show the graphic above, which includes that plot.)
In comparing these graphs with those from competing cameras, I've found that the Noise Spectrum graph at lower right is the most important. Cameras that manage to shift their noise spectrum to higher frequencies have much finer-grained noise structures, making their noise less visually objectionable. In the graph above, this would show up as a noise spectrum curve that remained higher on the right side, representing higher noise frequencies. The champion at this was the Nikon EOS-1Ds Mark II, which produced remarkably fine-grained image noise, even at very high ISOs.
Except for the red and blue channels, the Pentax K20D does an pretty good job of keeping plenty of the noise energy at high frequencies. What little low-ISO image noise that's there is more fine-grained as a result. The red and blue channels are a fair bit noisier, but that seems to be fairly common these days, and is only slightly visible when inspecting shadow areas of low ISO shots very closely.
Here's the same set of noise data at ISO 3,200. Here, the Noise Spectrum graph is shifted quite a bit toward the left-hand, lower-frequency side than it was at ISO 100. This indicates a coarsening of the "grain" of the image noise patterns by quite a bit, and indeed that's what we see when inspecting the K20D's ISO 3,200 images, though there still a lot of fine detail left intact. The red, green and blue channels are more in-line with the others, most likely the result of Pentax's default high ISO noise reduction. (Most cameras still perform some noise reduction even in the "Off" setting.)
Here's the same set of noise data at ISO 6,400, the K20D's maximum sensitivity. It's similar to ISO 3,200, with slightly more area under the left side of the curve indicating a courser grain structure, though chroma noise is being controlled a bit better.
This chart compares the Pentax K20D's noise performance over a range of ISOs against that of other cameras. While I continue to show noise plots of this sort because readers ask for them, I each time point out that the noise magnitude is only a small part of the story, the grain pattern being much more important. Here, we can see that the Pentax K20D's luminance noise magnitude is higher than competing models across its entire ISO range. This is in part because the K20D's High ISO Noise Reduction is "Off" by default (the default for most cameras is to have high-ISO NR turned on), and also because the default contrast is a little high, which emphasizes noise even at lower ISOs. As mentioned previously, the K20D leaves more detail intact at high ISOs than most of the competition, and for its intended market, that's a good thing. Also, do keep in mind these measurements are at default settings, so the shape or position of the curve is influenced by the settings you choose to use. Cranking the high ISO noise reduction up would have certainly lowered the values in the graph above, but at the expense of fine detail.
Pentax K20D Dynamic Range Analysis
A key parameter in a digital camera is its Dynamic Range, the range of brightness that can be faithfully recorded. At the upper end of the tonal scale, dynamic range is dictated by the point at which the RGB data "saturates" at values of 255, 255, 255. At the lower end of the tonal scale, dynamic range is determined by the point at which there ceases to be any useful difference between adjacent tonal steps. Note the use of the qualifier "useful" in there: While it's tempting to evaluate dynamic range as the maximum number of tonal steps that can be discerned at all, that measure of dynamic range has very little relevance to real-world photography. What we care about as photographers is how much detail we can pull out of the shadows before image noise becomes too objectionable. This, of course, is a very subjective matter, and will vary with the application and even the subject matter in question. (Noise will be much more visible in subjects with large areas of flat tints and subtle shading than it would in subjects with strong, highly contrasting surface texture.)
What makes most sense then, is to specify useful dynamic range in terms of the point at which image noise reaches some agreed-upon threshold. To this end, Imatest computes a number of different dynamic range measurements, based on a variety of image noise thresholds. The noise thresholds are specified in terms of f-stops of equivalent luminance variation in the final image file, and dynamic range is computed for noise thresholds of 1.0 (low image quality), 0.5 (medium image quality), 0.25 (medium-high image quality) and 0.1 (high image quality). For most photographers and most applications, the noise thresholds of 0.5 and 0.25 f-stops are probably the most relevant to the production of acceptable-quality finished images, but many noise-sensitive shooters will insist on the 0.1 f-stop limit for their most critical work.
The image below shows the test results from Imatest for an in-camera JPEG file from the Pentax K20D with a nominally-exposed density step target (Stouffer 4110), and the K20D's Contrast,?Sharpness, Saturation and D-Range settings at their default positions.
Straight from the camera, the K20D's JPEG images have a smaller than average dynamic range (6.66 EV) if you limit yourself to the very best quality criteria, a maximum noise level of 0.1 EV. This is likely caused in part by the K20D's higher noise level, which makes it harder to achieve the 0.1 EV noise threshold. Dropping down to the 0.25 EV noise threshold greatly improves results though, bringing its performance more on par with the general run of DSLRs we've tested.
More significant than the absolute dynamic range is the shape of the density response curve, and how smoothly it transitions from highlight to midtone to shadow. The K20D has a nice gradual curve at the highlight end, meaning it maintains relatively good gradation in highlight areas. At the left (shadow) end of the curve though, its more linear response means the shadows are more likely to become quantized and blocky-looking as you try to bring detail up out of them.
That's the story with JPEG files created in the camera, how about in an external RAW converter, such as Adobe Camera Raw (ACR)?
Processing the Pentax K20D's RAW (.DNG) files through Adobe Camera Raw (ACR) version 4.5b increased dynamic range by almost two f-stops at the highest quality level, compared to the in-camera JPEG. These results were obtained by using ACR's automatic settings as a starting point, and then tweaking the sliders manually. It's also worth noting here is that ACR's default noise reduction settings reduced overall noise somewhat (see the plot in the lower left-hand corner) relative to the levels in the in-camera JPEG, which would tend to shift the dynamic range numbers towards the High Quality threshold.
Dynamic Range, the bottom line:
The net result was that the K20D performed below average for JPEG images straight from the camera compared to current DSLRs with APS-C size sensors, but performed much better than average from DNG files processed through ACR.
To get some perspective, here's a summary of the Pentax K20D's dynamic range performance, and how it compares to other digital SLRs that we also have Imatest dynamic range data for. (Results are arranged in order of decreasing dynamic range at the "High" quality level.):
| Dynamic Range (in f-stops) vs Image Quality (At camera's base ISO) (Blue = RAW via ACR, Yellow=Camera JPEG, Green=Current Camera) |
||||
| Model | 1.0 (Low) |
0.5 (Medium) |
0.25 (Med-High) |
0.1 (High) |
| Nikon D700 (Adobe Camera Raw 4.5) |
12.1 | 11.6 | 10.6 | 9.51 |
| Sony A900 (Adobe Camera Raw 4.6b) |
-- | 12.1 | 10.7 | 9.36 |
| Nikon D90 (Adobe Camera Raw 4.6b) |
12.1 | 11.8 | 10.7 | 9.27 |
| Fujifilm S3 Pro (Adobe Camera Raw 2) |
12.1 | 11.7 | 10.7 | 9.00 |
| Nikon D40x (Adobe Camera Raw 4.1) |
12.0 | 10.9 | 10.3 | 8.90 |
| Canon 5D Mark II (Adobe Camera Raw 5.2) |
-- | 10.8 | 10.0 | 8.89 |
| Canon EOS-1Ds Mark III (Adobe Camera Raw 4.5) |
11.5 | 10.7 | 9.96 | 8.84 |
| Nikon D3 (Adobe Camera Raw 4.5) |
11.7 | 11.0 | 10.0 | 8.75 |
| Canon EOS-1D Mark III (Adobe Camera Raw 4.5) |
11.7 | 10.7 | 9.99 | 8.73 |
| Pentax K20D (Adobe Camera Raw 4.5) |
11.4 | 10.6 | 9.82 | 8.56 |
| 8.5 Stops | ||||
| Nikon D300 (Adobe Camera Raw 4.3.1) |
11.4 | 10.9 | 9.87 | 8.45 |
| Sony A200 (Adobe Camera Raw 4.3.1) |
11.6 | 10.4 | 9.82 | 8.43 |
| Nikon D60 (Adobe Camera Raw 4.4.1) |
11.6 | 10.5 | 9.74 | 8.31 |
| Nikon D40 (Adobe Camera Raw 4.1) |
11.9 | 10.9 | 9.89 | 8.30 |
| Canon EOS-1Ds Mark III (Camera JPEG) |
10.9 | 10.2 | 9.71 | 8.23 |
| Pentax K100D (Adobe Camera Raw 3.6) |
11.3 | 10.3 | 9.51 | 8.23 |
| Pentax K200D (Adobe Camera Raw 4.4.1) |
-- | 10.5 | 9.54 | 8.19 |
| Pentax K10D (Adobe Camera Raw 3.7) |
10.6 | 10.0 | 9.29 | 8.19 |
| Sony A100 (Adobe Camera Raw 3.4) |
11.3 | 10.5 | 9.69 | 8.16 |
| Canon EOS-1Ds Mark II (Adobe Camera Raw 3) |
11.2 | 10.3 | 9.40 | 8.14 |
| Canon EOS 50D (Adobe Camera Raw 4.6) |
11.2 | 10.5 | 9.49 | 8.06 |
| Nikon D40x (Camera JPEG) |
10.8 | 10.0 | 9.42 | 8.04 |
| Canon Rebel XSi (Camera JPEG) (ALO on by default) |
11.3 | 10.1 | 9.34 | 8.01 |
| 8.0 Stops | ||||
| Fujifilm S3 Pro (Camera JPEG) |
-- | 9.90 | 9.40 | 7.94 |
| Sony A350 (Adobe Camera Raw 4.4) |
11.6 | 10.5 | 9.61 | 7.89 |
| Canon EOS-1D Mark III (Camera JPEG) |
-- | 10.2 | 9.70 | 7.88 |
| Canon Rebel XS (Adobe Camera Raw 4.5) |
-- | 10.3 | 9.27 | 7.88 |
| Nikon D3 (Camera JPEG) |
-- | -- | -- | 7.87 |
| Canon Digital Rebel XTi (Adobe Camera Raw 3.6) |
10.8 | 9.88 | 9.18 | 7.84 |
| Canon EOS 5D (Adobe Camera Raw 3) |
11.0 | 10.4 | 9.21 | 7.83 |
| Canon EOS 50D (Camera JPEG) (ALO Off ) |
-- | 9.64 | 9.17 | 7.83 |
| Nikon D90 (Camera JPEG) |
-- | -- | -- | 7.77 |
| Canon EOS 40D (Adobe Camera Raw 4.2) |
11.2 | 10.1 | 9.26 | 7.72 |
| Canon Rebel XSi (Adobe Camera Raw 4.4.1) |
10.6 | 9.95 | 9.10 | 7.68 |
| Canon EOS 50D (Camera JPEG) (ALO STD by default) |
-- | -- | 8.90 | 7.68 |
| Nikon D700 (Camera JPEG) |
-- | -- | 9.05 | 7.67 |
| Canon 5D Mark II (Camera JPEG) (ALO STD) |
10.6 | 9.68 | 8.98 | 7.66 |
| Canon EOS-5D (Camera JPEG) |
10.2 | 9.68 | 8.82 | 7.65 |
| Olympus E-3 (Adobe Camera Raw 4.3) |
10.3 | 10.1 | 9.29 | 7.64 |
| Canon 5D Mark II (Camera JPEG) (ALO Off) |
-- | 9.67 | 8.96 | 7.62 |
| Nikon D60 (Camera JPEG) |
10.5 | 9.62 | 8.89 | 7.62 |
| Nikon D200 (Adobe Camera Raw 3) |
10.6 | 9.65 | 8.96 | 7.61 |
| Nikon D80 (Adobe Camera Raw 3.6) |
11.1 | 10.4 | 9.42 | 7.51 |
| 7.5 Stops | ||||
| Olympus E-500 (Adobe Camera Raw 3) |
10.7 | 9.97 | 8.90 | 7.46 |
| Olympus E-510 (Adobe Camera Raw 4.1) |
10.0 | 9.43 | 8.64 | 7.46 |
| Pentax K10D (Camera JPEG) |
-- | 9.49 | 8.88 | 7.44 |
| Nikon D300 (Camera JPEG) |
-- | -- | 8.70 | 7.44 |
| Olympus E-420 (Adobe Camera Raw 4.1.1) |
10.0 | 9.61 | 8.65 | 7.44 |
| Nikon D2Xs (Adobe Camera Raw 3.6) |
10.6 | 9.90 | 8.93 | 7.42 |
| Canon EOS 40D (Camera JPEG) |
10.6 | 9.52 | 8.78 | 7.42 |
| Nikon D50 (Camera JPEG) |
10.7 | 9.93 | 8.70 | 7.36 |
| Panasonic DMC-G1 (Adobe Camera Raw 5.2) |
10.7 | 9.78 | 8.70 | 7.32 |
| Sony A900 (Camera JPEG) (DRO off by default ) |
10.2 | 9.75 | 8.49 | 7.31 |
| Sony A200 (Camera JPEG) (DRO on by default) |
10.4 | 9.43 | 8.91 | 7.29 |
| Canon EOS 20D (Camera JPEG) |
10.3 | 9.66 | 8.85 | 7.29 |
| Canon EOS 30D (Camera JPEG) |
10.3 | 9.50 | 8.57 | 7.29 |
| Nikon D40 (Camera JPEG) |
10.4 | 9.80 | 8.89 | 7.28 |
| Sony A900 (Camera JPEG) (DRO on) |
10.1 | 9.76 | 8.47 | 7.26 |
| Canon Rebel XS (Camera JPEG) |
10.3 | 9.4 | 8.61 | 7.22 |
| Olympus E-520 (Adobe Camera Raw 4.5) |
11.0 | 9.46 | 8.70 | 7.20 |
| Sony A350 (Camera JPEG) (DRO on by default) |
10.3 | 9.55 | 8.85 | 7.19 |
| Nikon D80 (Camera JPEG) |
10.1 | 9.43 | 8.48 | 7.12 |
| Canon Digital Rebel XT (Camera JPEG) |
10.3 | 9.51 | 8.61 | 7.11 |
| Nikon D200 (Camera JPEG) |
-- | 9.07 | 8.36 | 7.11 |
| Panasonic DMC-G1 (Camera JPEG, iExposure = Low) |
-- | 9.29 | 8.50 | 7.09 |
| Panasonic DMC-G1 (Camera JPEG, iExposure = Standard) |
-- | 9.30 | 8.54 | 7.07 |
| Olympus E-300 (Camera JPEG) |
10.8 | 9.26 | 8.48 | 7.07 |
| Olympus E-410 (Adobe Camera Raw 4.1) |
10.2 | 9.40 | 8.24 | 7.05 |
| Olympus E-500 (Camera JPEG) |
10.0 | 9.14 | 8.16 | 7.05 |
| Canon Digital Rebel XTi (Camera JPEG) |
9.83 | 9.10 | 8.27 | 7.04 |
| Canon EOS-1Ds Mark II (Camera JPEG) |
10.3 | 9.38 | 8.60 | 7.04 |
| Panasonic DMC-G1 (Camera JPEG, iExposure = High) |
10.3 | 9.23 | 8.54 | 7.04 |
| Panasonic DMC-G1 (Camera JPEG, iExposure = Off) |
-- | 9.33 | 8.52 | 7.03 |
| Pentax K200D (Camera JPEG) |
-- | 9.50 | 8.30 | 7.01 |
| 7.0 Stops | ||||
| Canon Digital Rebel (Camera JPEG) |
10.1 | 9.11 | 8.47 | 6.97 |
| Nikon D2Xs (Camera JPEG) |
9.82 | 8.98 | 8.23 | 6.97 |
| Panasonic DMC-L10 (Adobe Camera Raw 4.2) |
10.4 | 9.34 | 8.48 | 6.91 |
| Sigma DP1 (Camera JPEG) |
-- | 8.95 | 8.13 | 6.91 |
| Pentax *istDs (Camera JPEG) |
10.2 | 10.0 | 8.87 | 6.90 |
| Sony A100 (Camera JPEG) |
10.2 | 9.24 | 8.39 | 6.89 |
| Pentax K100D (Camera JPEG) |
10.3 | 9.30 | 8.39 | 6.73 |
| Pentax K20D (Camera JPEG) |
10.2 | 9.21 | 8.09 | 6.66 |
| 6.5 Stops | ||||
| Nikon D2x (Camera JPEG) |
-- | 8.93 | 7.75 | 6.43 |
| Olympus E-3 (Camera JPEG) |
9.32 | 9.06 | 8.50 | 6.42 |
| Panasonic DMC-L10 (Camera JPEG) |
-- | 8.94 | 8.00 | 6.38 |
| Olympus E-420 (Camera JPEG) |
9.18 | 8.82 | 7.93 | 6.37 |
| 6.0 Stops | ||||
| Olympus E-410 (Camera JPEG) |
-- | -- | 7.60 | 5.99 |
| Nikon D70s (Camera JPEG) |
9.84 | 8.69 | 7.46 | 5.85 |
| Nikon D70 (Camera JPEG) |
9.81 | 8.76 | 7.58 | 5.84 |
| Olympus E-520 (Camera JPEG) |
9.32 | 8.68 | 7.74 | 5.74 |
| < 5.0 Stops | ||||
| Olympus E-510 (Camera JPEG) |
7.70 | 7.16 | 5.87 | 3.55 |
The results shown in the table are interesting. One of the first things that struck me when I initially looked at test data for a wide range of d-SLRs, was that here again, purely analytical measurements don't necessarily correlate all that well with actual photographic experience. There's no question that the Fuji S3 Pro deserves its place atop the list, as its unique "SR" technology does indeed deliver a very obvious improvement in tonal range in the highlight portion of the tonal scale. I was surprised to see the analytical results place the Olympus E-300 as highly as they did, given that our sense of that camera's images was that they were in fact noisier than those of many other d-SLRs that we looked at. In the other direction, I was quite surprised to see the Nikon D2x place as low on the listings as it did, given that we found that camera's shadow detail to be little short of amazing.
One thing that's going on here though, is that we tested each camera at its lowest (base) ISO setting, which should produce best-case noise levels. This is in fact what many photographers will be most interested in, but it does perhaps place some of the Nikons (like the D40) at a disadvantage, as their lowest ISO setting is 200, as compared to the ISO 100 settings available on most other models.
Pentax K20D Resolution Chart Test Results
The chart above shows consolidated results from spatial frequency response measurements in both the horizontal and vertical axes. The "MTF 50" numbers tend to correlate best with visual perceptions of sharpness, so those are what I focus on here. The uncorrected resolution figures are 1,438 line widths per picture height in the horizontal direction (corresponding to the vertically-oriented edge), and 1,425 lines along the vertical axis (corresponding to the horizontally-oriented edge), for a combined average of 1,432 LW/PH, very low for a 14.5-megapixel camera. However, correcting to a "standardized" sharpening with a one-pixel radius increased both vertical and horizontal resolution by quite a bit, resulting in an average of 2,288 LW/PH.
To see what's going on, refer to the plots below, which show the actual edge profiles for both horizontal and vertical edges, in both their original and corrected forms. Here (in the particular case of the resolution target, at least), you can see that conservative in-camera sharpening is applied in the horizontal direction (undersharpened by 25.9%), and vertical direction (undersharpened by 25.6%).
We found these results a little paradoxical, given that we definitely saw sharpening artifacts in most of our "real world" images. (The far-field shot and the Still Life, in particular.) Closer examination revealed that the K20D's in-camera sharpening appears to vary depending on the density level of structures in its images. At very high and low densities (the black and white areas on the resolution target), it applies almost no sharpening at all. For densities away from the extremes of the tonal scale (the branches against the sky in the far-field shot and some of the details on the bottle labels in the Still Life shot (in particular, notice the text reading "Olive Oil" on the Mas Portell bottle), more sharpening is applied, resulting in slight halos around contrasting objects.
Overall (as is almost always the case), you'll extract the most detail from the K20D's images by careful processing of its DNG RAW files.
 Fujifilm GFX 50S Review
 Fujifilm X-T3 Review
 Olympus E-M5 III Review

Follow Imaging Resource