MISMEASUREMENT MYSTERY
Datacolor Spyder3Print --
An Adventure in Profiling
By MIKE PASINI
Editor
The Imaging Resource Digital Photography Newsletter
Review Date: March 2009
It's always an adventure around here. After discovering a few things even X-Rite didn't know about its ColorMunki, we were looking forward to creating printer profiles with the $499 Datacolor Spyder3Print (but you can save 30 percent).
It's been around a lot longer and, we thought, wouldn't be the mystery that the ColorMunki software had been.
But it wasn't quite that simple.
It turns out we had a very difficult time creating a usable printer profile with Datacolor's spectrocolorimeter. We knew it could be done (it's the device in use at the Imaging Resource lab in Atlanta) but we could not duplicate that success.
A few email exchanges with Datacolor and we eventually we did get a handle on the problem. Whether you own a Spyder3Print or are thinking about getting one, we hope our little adventure makes your life a little easier.
Let's review the features, specifications and requirements before getting to work.
Datacolor lists a number of appealing features for the Spyder3Print, including:
• Speed and Accuracy. Create custom profiles with any of several standard color or black and white targets. A new SpyderGuide helps align the spectrocolorimeter to the target.
• New SpyderProof Function. Softproof any of a series of real images using your own custom profiles. Print the sample images directly from SpyderProof to check your profile results.
• Curves Import Function. Control Color and Black & White Tinting curves in your Image Editor, applying adjustments to the profile rather than to each individual image.
• Precision Gray Axis Algorithm. Extended Grays Target adds precision gray and near gray data to profiles, enhancing quality of Tinted and Black and White prints.
• New L-Star Workflow Option. Allows L-Star users to build profiles that coordinate with their L-Star display calibration and L-Star working space.
• PreciseLight Function. Adjust profile settings to optimize your print based on where and how it will be displayed, previewing and adjusting to different ambient lighting conditions.
• Supports 16-bit profiles. Supports both 8-bit and 16-bit profiles so you can faithfully reproduce the most subtle elements of your work.
• Advanced Presets. Select prebuilt or custom sets of advanced profiles settings to produce profiles with specific combinations of highlight and shadow tint, plus detail and neutrality settings.
• A Printing Primer & Comprehensive On-Screen Help. Datacolor boasts that the Spyder3Print on-screen help is actually a primer on how to get great prints.
• Integrated Print Quality and Media Settings Check. Helps verify that your printer is configured and operating correctly.
• Easy to Use. Photo-Centric User Interface means you don't have to be a color expert to get outstanding results.
SPECIFICATIONS | Back to Contents
Specifications for Spyder3Print include:
- Targeted for photographers, fine art printers, production professionals
- Datacolor 1005 Spectrocolorimeter
- Gamma Choices include unlimited choices, user defined
- Color Temperature Choices include unlimited choices, user defined
- Three levels of color targets, plus extended gray targets
- Desktop cradle/calibration tile
- 7mm diameter aperture size
- Expert Console
- Custom B&W Luminance Control
- SpyderProof Interface
- Gamma Curve Editing
- L-Star Workflow Option
- Curves Import Function
- Precise Light Function
- Supports 16-bit Profiles
- Precision Gray Axis Algorithm
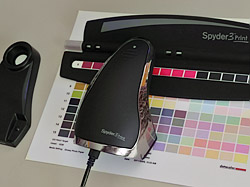
The Ingredients. The cradle with white calibration tile, the SpyderGuide and the spectrocolorimeter. Color chart not included (you'll have to print your own).
The Spyder3Print box contains:
- Datacolor 1005 spectrocolorimeter
- Spectrocolorimeter Base
- 6-foot mini USB Cable
- Spyder3Print Software CD
- New SpyderGuide
- Spyder3Print Quick Start Guide
- One-year Warranty
SYSTEM REQUIREMENTS | Back to Contents
- Windows XP 32/64, Vista 32/64
- Mac OS X (10.3 or higher)
- USB
- Color monitor resolution 1024x768 or greater
- 16-bit video card (24-bit recommended)
- 128MB of available RAM
- 100MB of available hard disk space
INSTALLATION | Back to Contents
We installed the software after downloading the current version (just a beta, and it's been a beta for a long time now) from the Datacolor site. That went fine.
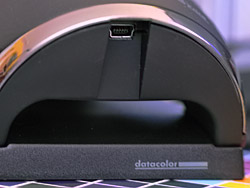
USB Connection. Simple USB connection at rear of spectrocolorimeter.
Attaching the spectrocolorimeter, however, mystified us for a while.
Like other devices of its kind, it requires the full 500 mA bus power of a USB port. You can't share the port power with anything (so you can't, for example, plug this into the USB port on your keyboard or use a non-powered hub).
We have a free port on a daisychained but powered USB port that we use for temporary connections like this. But when we used that port with Spyder3Print, it couldn't find the spectrocolorimeter.
The problem, it turned out, was that we were attaching the spectrocolorimeter after launching Spyder3Print. The software, however, only looks at the port at launch so it didn't see the spectrocolorimeter. When we made the USB connection and then launched the software, we had no problem.
CREATING A PROFILE | Back to Contents
We had trouble creating our first profile. But that's our job.
Datacolor's job is to make it easy and they've provided a very helpful video we enjoyed (except for the sound quality). Life any video, however, it isn't very easy to see precisely what's going on. But it's nice to see someone actually doing this.
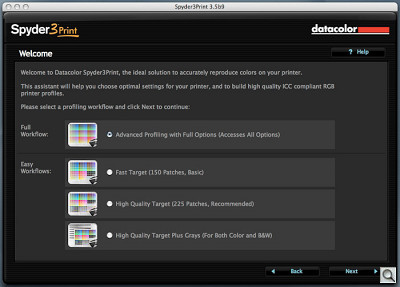
Software. Click the image to see the gallery of screen shots with captions.
The software for this sort of thing, as we mentioned in our ColorMunki review, has become a great deal more sophisticated than it used to be. There is plenty of HTML help just a click away on any screen. And while the software runs as a standalone application rather than in your Web browser, it's very much like using a Web browser.
You're first time through may be a little confusing because the screens have a lot to say, especially if you select the Full Workflow option. But you'll find the Easy Workflow gets to the meat of the matter very quickly.
In fact, the process itself is straightforward. You setup your printer driver, print a sample chart (we stuck with the popular 225 patch color chart), calibrate the spectrocolorimeter, use the device to read each patch and then the software creates a profile.
Still there were complications.
The first complication was the number of charts you can print. Since the basic chart is 225 patches, we opted to leave it at that until we learned how to use the thing. That's a lot of patches to read and, yes, it is laborious. The two-page charts we saved for later.
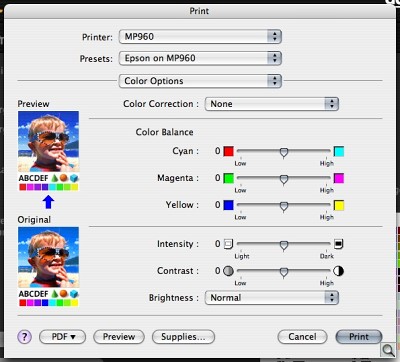
Driver Setup. Disabling color managemenet (shown here) and setting the right paper type are essential to profiling the printer.
But we have to give credit to Datacolor for providing so many options, particularly for black and white printing. The ColorMunki approach would be to create a printer profile from their standard 50-patch chart, load a black and white image and fine-tune the profile with the black and white chart printed from that image. But Datacolor gives you a two-page chart to print right off the bat. If you want to tweak the profile further, there are advanced editing options that let you do so.
The second complication was making the USB connection, as we described above.
But with a chart printed, the program suggested we wait 30 minutes for the paper to stabilize. That's good advice for swellable papers using dye inks. If you are using a porous paper and pigments, you don't have to wait. If you are using porous paper and dyes, you are working with the least stable combination you could. Don't do that.
Thirty minutes is a long time. Ten minutes would do, we think.
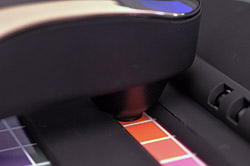
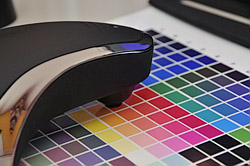
READING PATCHES | Back to Contents
If those complications were minor, the next one was not. Reading the patches looks simple. It's not.
When we were ready to make readings, we were at first a little distressed to see we would have to slide the spectrocolorimeter over the unread rows of patches to read the current row. We didn't scratch any, it turns out, but what a not-very-bright idea.
The video had warned us to put two pieces of paper under the chart to avoid any imprecision caused by the color of the table surface. Handy advice even if it sounds a little superfluous for heavy photo paper.
Datacolor supplies a SpyderGuide for the spectrocolorimeter and we opted to use that, although the video didn't use it. It does slow you down a bit because you have to move the guide from one row to the next. And, we found, you really don't need it. Just tape the chart to your table so it won't slip around and position the spectrocolorimeter's nose precisely on each patch.
Reading the 225 patches takes a while. Phone calls, meals, naps, all sorts of things can intervene, so plan ahead. Reading a patch doesn't take long, but you're likely to want to take a breath after each row and there are 15 rows. Allow 10 to 15 minutes to read the chart. And don't rush it.
There are 15 patches in each row and it can be a bit confusing to remember which one is next. The onscreen chart indicates where you are, but the guide can obscure the column headings. We did get lost a few times and had to check the onscreen guide.
If you really get lost, you can use the arrow keys to back up to a patch you want to return to and have another try. In fact, while the software goes sequentially from patch to patch, you can read any patch at any time. You just have to tell the software which patch you're reading by arrowing to it on the screen.
After quite a few patch readings, we discerned that the cute audible click confirming each reading was actually two sounds. The first confirmed the reading had been taken (a "finish measuring" sound) and the second confirmed the spectrocolorimeter was ready for the next reading (a "start measuring" sound).
We always clicked on a patch in silence but we often found ourselves lifting the spectrocolorimeter up after hearing the finish sound only to find the light still on. That compromises the measurement, we were told.
In fact, you should just slide the device along, rather than lift it. Which, again, would seem to risk scratching the chart.
Then, too, the patches are no bigger than they have to be. We found it very difficult to hit the sweet spot on every patch. The guide kept us within the north and south boundaries, so to speak, but east and west were approximations. Still, we felt we hadn't missed any.
Datacolor suggests using the Return key on your keyboard to register a measurement rather than the button on the nose of the spectrocolorimeter. If you do that, they say, you can measure the 225 patch target in 2.5 minutes. We were nowhere near that, though.
The measurement process reminded us of a one-fingered typist. The audio feedback does indeed sound like a clacking key and the end-of-line bell rings like a manual typewriter. When you finish the chart, it dings twice.
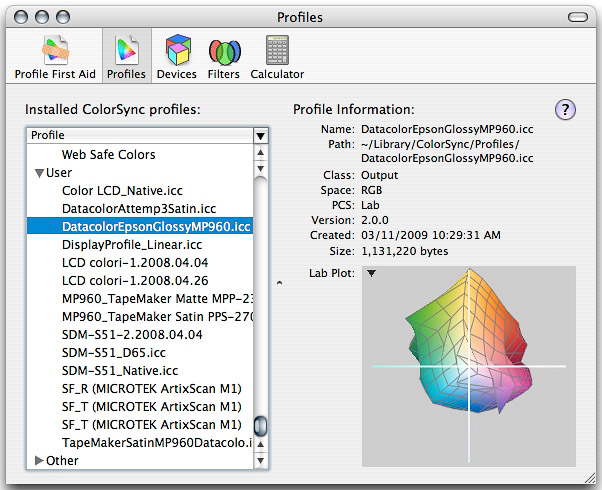
Mutant Profile. Click the image to see the gallery of profiles with captions.
When we finished our readings, the program built our profile and we took a look at it using ColorSync Utility. Unfortunately, the plot of the profile looked like a box that had been air freighted by a company that had thrown the box across the country rather than fly it.
We tried a second reading of the chart without the guide and did even worse.
So we tried a third, this time using the guide again and taking our time. We even went back over a few questionable patches, patches that didn't look like a good match on screen. You can easily switch between the pure colors and the measurements by using the 1 and 3 keys on the keyboard.
By then we had the room lights on. But that created another problem. It wasn't that the room light affected the reading itself. The spectrophotometer shades the area so only its light is used to take the reading. It was more that some light (like incandescent or warm fluorescents) can filter some patches (like light yellow) so you aren't sure you're aligned properly over them.
USING THE PROFILE | Back to Contents
The application puts the profile in the place your system looks for it, so your application can get its hands on it when you need it. You do have a few options (whether to share it with other users and to rename it, for example).
In our case, to use the profile we opened Photoshop CS3 and applied the profile in the Print dialog box by telling Photoshop to manage color and selecting the printer profile we had just created.
We printed the same image using two Datacolor profiles, a ColorMunki profile we had made for the same paper and then we made an unprofiled print that let the printer manage the color. ColorMunki made the best print, followed by the unmanaged print. The two Datacolor profiles were so off the mark they really couldn't be considered prints.
And, in fact, looking at the profile plots, we had to wonder how the spectrocolorimeter could have been seeing the same test chart. While the general shape was similar, each chart had extreme deformations on different sides of the 3D image. Wow.
Something was wrong.
BACK TO DENMARK | Back to Contents
To find out exactly what was wrong, we started from scratch with a different paper.
We printed the 225-patch color chart on Epson Photo Paper, waited half an hour and then scanned the patches.
Again the profile the program created had strange spikes and indentations in the plot. Still we tried a print.
The color just wasn't right. The print had a greenish cast and smooth gray gradations were posterized.
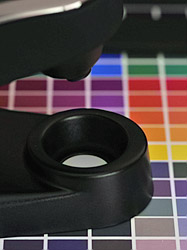
Cradle. The white tile calibrates the spectro.
CALIBRATING | Back to Contents
Before reading the first chart in a session, the program calibrates the spectrocolorimeter. You're prompted to put it in its cradle, which has a while tile embedded in it. And with a press of the Return key or a click of the spectrocolorimeter's nose, a reading is taken. That's all it takes.
Every now and then you have to clean the white tile or your results will be skewed. Datacolor recommends using a "lens cloth or a paper towel. Avoid using rags or other non-lens cloth, as it may contain optical brightners, which could effect white tile measurements. Mild cleaning solvents such as Windex or Isopropyl Alcohol can be used as needed."
In fact, the company recommends cleaning both the tile and the tip of the spectrocolorimeter when your white values show as bright cyan.
Looking at our measured values compared to the original values on the color charts, we had noticed a blue tinge. Was our white tile dirty?
We had never cleaned it because, well, it was new. But looking at the tile, there was a bit of dirt on it, probably from ink picked up by the nose. So after we moistened a lens cloth and wiped it clean, we ran the cloth around the edge of the spectrocolorimeter's tip, too, to remove any ink picked up from the printed charts.
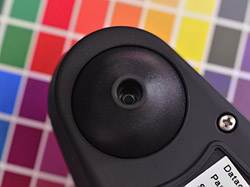
Spectro Tip. Cleaned, calibrated and ready to go again.
IF AT FIRST | Back to Contents
With a clean spectrocolorimeter, we measured our Epson chart again. We used the guide to help with the top/bottom alignment of the spectrocolorimeter tip and took our time.
This time we got a chart without all the punctures and distortions. There was a large dent, however. We had never seen anything like that with our ColorMunki profiles, so we suspected we had not gotten to the bottom of the problem.
The only way to tell was to print a photo.
No, still no sale. The print was, like the first Datacolor-profiled one, too green and showing a posterization between graduated tones. Printing with a profile designed for a Canon photo paper (and hence not quite right for our Epson sheet), they were quite smooth.
To eliminate the spectrocolorimeter itself, we swapped it out, using an older one (shipped with PrintFIX Pro, which uses an amber lamp instead of the red one in the current device). Again we had strange spikes in our profile and the print looked green with posterized gray tones.
SpyderGuide. Just slide it along.
It wasn't the spectrocolorimeter.
THE CAVALRY | Back to Contents
Rather than admit defeat, we called in the cavalry. Datacolor Global Product Technology manager C. David Tobie came to the rescue when we sent him the XML file of our measured readings (tucked away in the preferences folder of our home directory).
He compared the chart data against the data we had measured and found a few problems:
"There appear to be a number of mismeasured patches in this target. The most obvious is A4, which is brown instead of green. But a number of others are questionable as well," he said. "I would also remeasure row 8, or at least the end of it, as there are a couple of gray patches there that show as teal. And there are less dramatic errors such as patch C7 that show up as being not quite correct."
To make the corrections, you click through the application's screens to the Read Patches screen. There you can load an existing measurements file. Click on the chart and use the arrow keys to navigate to the patches you want to remeasure.
Freewheeling. Just slide it along -- without the guide.
David reminded us to use the 1 and 3 keys to toggle the display between the pure and measured values. "The ones that need remeasurement will jump out," he said.
We had compared our initial measurements to the pure colors but we hadn't paid very close attention to the discrepancies. He was quite correct that, for example, A4 was brown instead of green. But because we had measured A4 carefully ourselves, we didn't suspect anything was particularly wrong with the measurement. In fact, quite a few measurements seemed suspicious when we studied the chart.
By the time we were done, we'd remeasured half the chart.
And, to our great relief, the plot of the new profile did not have the mutations we had been getting. Even better, our print did not show either the greenish cast or the posterized gray tones.
We had, finally, built a useable printer profile.
THE PROBLEM | Back to Contents
So why were we able to get good readings when we made the corrections? We asked David what could cause a bad measurement.
"That depends on the user and how they are using the device. In my own measuring, I typically won't have a single 'bad' patch in an entire target," he said. "New users may make various misjudgments, from lifting the spectro too soon, to not having it entirely on the patch, or flat on the target, that could cause misreadings.
"In most cases, simply pointing out that it needs to be done more carefully, and then checked, is sufficient to bring people to a 'self-monitoring state' where they can deal with it themselves from then on. "On the other hand, people can be way too deliberate and compulsive about it, and slow the process down. So we don't make too big a deal about working slowly and carefully, as that would cause the engineers out there to absolutely crawl, and then claim that it takes them hours to read a target, which need not be true."
We asked Publisher Dave Etchells about this, too.
"I did fairly quickly notice that the beep tended to come a little early," he confirmed.
"I had a swatch in which I thought I might in fact have gotten a bit ahead of the reading and noticed that the measured value looked lighter and more pink than similar swatches next to it. That tipped me off to be more cautious. I jumped the gun a few other times, but generally had a pretty good idea of when I'd gone too fast.
"I didn't find it very difficult to see the mismeasured swatches, they pretty much always stood out on even a casual inspection. Once I got the rhythm down, it typically took me about 7-10 minutes to read a full page of swatches."
He did better than we did. "Overall results were quite good, at least for the printers I profiled. The one oddness I did find was that a truly grayscale test pattern (it started life as a grayscale file) had some odd chroma and tonal breaks in it when I used the profile I'd generated.
"Other prints I made came out quite good, very close to what I was seeing on-screen. I did see some tendency to plug up a particular dark maroon color, but I think that may have been an issue with the gamut of the output device, rather than a problem with the profile."
We suspect our problem was in moving the spectrocolorimeter immediately after hearing the beep. As we'd discovered when we lifted it from patch to patch, the lamp did not always turn off before the beep.
The printer profiling process itself is well handled in the software, although we have qualms about running the spectrocolorimeter over the unscanned rows of printed color patches. We did appreciate the multiple test targets. Being able to tune your profile for black and white printing, for example, was a welcome advantage.
But, after doing quite a few of these, we're no fan at all of manually clicking on 225 patches. Of course, to profile a new paper, you would only have to scan them once -- if you do it right.
And that's the rub. Doing it right was much harder than it should be. And telling if you'd done it right was not as easy as it should be either. We resorted to the profile plot to see which areas of the 225 patch chart we had to remeasure, although you can just flip between the pure and measured values. It's just that with 225 of them, the plot was much easier to evaluate.
In the end, we did get a good profile. And while that certainly counts, forgive us if we seem to lack our usual enthusiasm for finally achieving success.