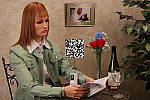
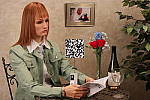
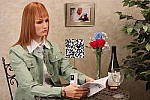
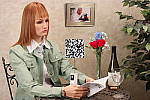
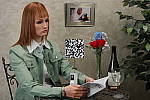
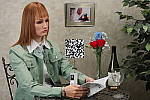
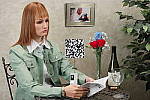
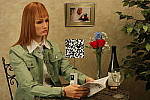
Samsung NX500 Review – Test Shots

Add us on

Digital Cameras – Samsung NX500 Test Images

Not sure which camera to buy? Let your eyes be the ultimate judge!
Visit our Comparometer(tm)
to compare images from the Samsung NX500 with those from other
cameras you may be considering. The proof is in the pictures, so let
your own eyes decide which you like best!

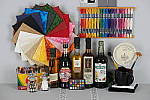
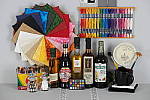
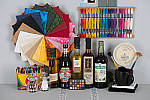
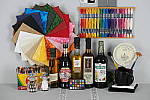
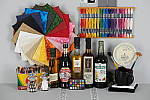
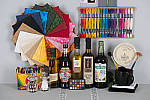
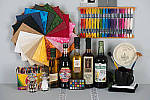
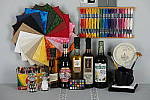
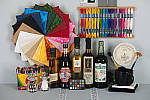
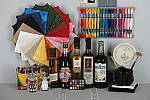
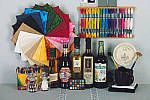
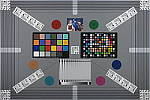
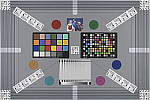
Still LifeSamsung NX500 Sample images image 1

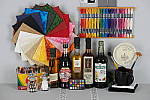
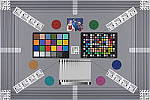
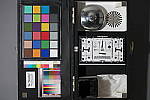
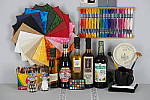
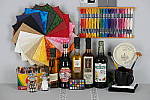
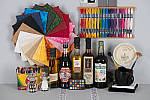
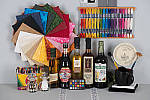
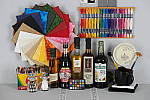
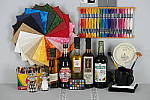
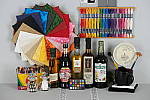
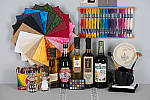
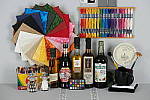
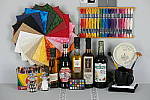
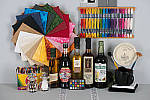
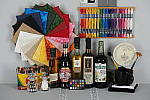
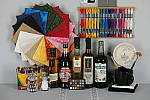
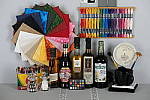
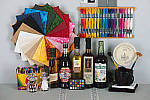
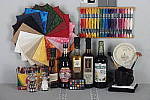
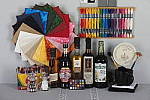
This is our new “Still Life” test target. We’re combining
some of the elements from previous shots (DaveBox and Res Chart) into
this and the “Multi Target” shot below, plus added a number
of elements that are very revealing of various camera characteristics
and foibles.

Here’s what to look for in this target:

  • Tone-on-tone detail & noise suppression:
    The cloth swatches in the pinwheel were chosen because they show a lot
    of tone-on-tone detail, across a broad range of colors. This is just
    the sort of detail that noise suppression processing tends to flatten
    out. If you look at the detail in these swatches as the ISO increases,
    you’ll see just where different cameras start to lose subtle detail.
    — The white and tan swatches and the dark swatches tend to be particularly
    revealing of this. The label of the vinegar bottle (second from the
    right) is another great place to look for lost detail from noise suppression,
    as the image of the person at the top of the label is actually a depiction
    of a mosaic. The dark colors in the background and in the figure’s clothes
    contain detail that’s very quickly lost when a camera’s noise suppression
    system kicks in. Cameras with really high-quality, low-noise sensors
    that require little noise suppression will be able to hold onto the
    detail in these areas, many others will show only a uniform swath of
    smudged color.

    Another place where you’ll quickly see the effects of over-aggressive
    noise suppression is in the white salt grains of the salt grinder in
    lower left. Cameras are often more conservative about suppressing noise
    in highlight areas (because our eyes tend to see less of it there),
    but many cameras seem to have a hard time holding onto the subtle shadings
    that distinguish the salt grains from each other, particularly at higher
    ISO levels.

  • Fine Detail: You’ll find a lot of fine detail
    in the label of the beer bottle on the right, in its fine cursive text,
    but the other bottle labels hold a lot of fine detail as well. Fine
    text is often a good visual indicator of resolution, because our brains
    have an excellent idea of what the text should look like, so
    are very quick to notice even minor loss of detail.

    For really fine detail, look to the circular scale/calculator on the
    right side of the scene. Some of the fine lines there are extremely
    fine indeed. Looking at results from many different cameras with this
    target, we found that camera noise-suppression systems often confuse
    the fine lines with image noise, and so flatten them out. There’s also
    a nice range of fine text sizes in this chart as well, once again great
    visual cues for resolution and detail.

  • Highlight Detail: Three elements in this scene
    show off (or show up) a camera’s ability to hold onto highlight detail.
    As mentioned above, the salt grains (and reflections of the studio lights)
    in the salt mill are examples of fairly subtle highlight detail that
    cameras’ anti-noise processing sometimes obliterate. The folded white
    cloth under the mug on the right side of the frame likewise shows a
    lot of white-on-white detail that is easy to lose, particularly if a
    camera’s tone curve is too contrasty. As it turns out though, the most
    sensitive test of a camera’s highlight abilities seems to be the hank
    of white embroidery thread in the upper right corner. These fibers are
    unusually bright and reflective, so its easy for a camera to blow out
    detail in them.

  • Shadow Detail: Several elements of this subject
    are useful for evaluating shadow detail, particularly the black mug
    and the pieces of folded black velvet, both under and inside the mug.
    The bottoms of the beer bottles also provide some gradations of deep
    shadow, and the clump of peppers in the bottom of the pepper oil bottle
    had a fair bit of detail that’s far down at the shadow end of the tone
    curve.

    We were actually surprised when we constructed this scene just how dark
    the velvet and sides of the beer bottles ended up being. Even with the
    bright studio lights shining directly on it, the velvet in particular
    stays way, way down at the shadow end of the tone curve. With most cameras
    and on most monitors, the velvet will simply appear as an unrelieved
    swatch of black. To see whether it contains deep detail or not, in most
    cases you’ll have to open the file in an image editor and boost the
    brightness dramatically, to bring the detail up into a visible range.

  • Preservation of “Shape” in Strong Colors:
    As you approach the extremes of a camera’s color gamut (its range of
    recordable colors), it becomes more and more difficult for the camera
    to show fine gradations of tone, because one or more of the RGB color
    channels are close to saturation. It’s not uncommon to see a brightly
    colored piece of clothing or a vibrant flower appear in digicam photos
    as just a blob of color, because the camera ran up against the limits
    of its color gamut. The brightly colored embroidery threads in the upper
    right portion of the Still Life target are good examples of situations
    where this might happen. Pay particular attention to the bright red
    and dark blue colors here, as these are both colors near the edge of
    the typical sRGB color gamut.

  • Color accuracy and white balance: It’s pretty
    small in there, but we’ve included a mini-MacBeth chart, which displays
    very carefully controlled color swatches. Our Multi Target (see below)
    sports a full-sized MacBeth chart, but the one here serves as a good
    check of color balance and rendition, and is also useful for checking
    white balance on this particular shot.

  • Image noise and detail vs ISO: As mentioned above,
    this target contains many elements useful for evaluating detail loss
    to anti-noise processing. We’ll therefore always shoot a full set of
    test images of this target across each camera’s ISO range, for every
    camera we test. (See below.)
ISO Series, High ISO NR = On (Default)
ISO 100 ISO 200 ISO 400 ISO 800 ISO
1,600
ISO 3,200 ISO 6,400 ISO 12.8K ISO 25.6K ISO 51.2K
ISO Series, High ISO NR = Off
ISO 100 ISO 200 ISO 400 ISO 800 ISO 1,600
ISO 3,200 ISO 6,400 ISO 12.8K ISO 25.6K ISO 51.2K

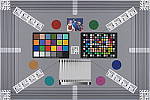
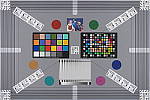
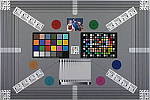
Multi TargetSamsung NX500 Sample images image 2

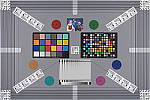
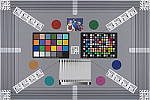
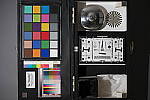
Our new “Multi Target” was first put into use in April, 2009, replacing the earlier “interim” design. This target incorporates a number of elements that combine aspects of the previous Multi target, as well as the previous Viewfinder Accuracy or “VFA” chart. Here’s some of what you’ll find in this target:

Framing marks: This chart evolved from the earlier Viewfinder Accuracy chart, so one of its major uses is to measure viewfinder accuracy. (See notes in the Viewfinder Accuracy section, at the bottom of this page, for more information on this.)

USAF resolution targets: An important use of this target is in evaluating lens quality, looking how well sharpness holds up as you move from the center to the corners of the frame. The little “USAF” resolution targets arranged at the center, in the corners, and along the diagonals are very useful for making fine judgements about blur, flare and aberrations in the image. We generally show crops of a USAF chip from a corner of the target and from the center, to show how lenses hold sharpness at wide and telephoto focal lengths.

Alignment “bullseyes:” We find these graphics from the graphic arts world (used to align sheets of film in the old film-based prepress days) very useful for seeing chromatic aberration in lenses. The bold black/white elements are good for seeing the colored fringes caused by CA in the corners of the frame.

MacBeth ColorChecker Chart: This is about as common a color standard as you can get these days, very widely available for only mildly exorbitant cost, and quite well controlled in its production. It thus serves as a good basis of comparison between cameras and between test setups. Imatest also understands the MacBeth colors very well, and uses them to produce its color accuracy map that we feature in all our reviews.

MacBeth ColorChecker SG Chart: The ColorChecker SG chart provides a wider range of colors, to give a more detailed map of a camera’s color handling. We haven’t begun using this chart in the color-accuracy graphs we routinely offer, but expect to do so at some point in the future. In the meantime, we sometimes refer to this chart internally, to get a more complete idea of what a camera’s color map looks like.

Log C/F Target: The progressive resolution pattern located just below the center of the target is a Log C/F (logarithmic contrast vs spatial frequency) chart. Digital camera noise reduction routines work by looking at levels of local contrast, flattening-out detail at progressively lower spatial frequencies as the local contrast decreases. (This is very commonly seen in human hair, grass, foliage, and other subjects with subtly-contrasting fine detail.) This chart lets Imatest analyze just how a camera makes the tradeoff between contrast, detail, and image noise.

Color Starbursts: The six circular starburst elements arranged around the target are intended to reveal de-mosaicing artifacts and color-dependent resolution issues. The six starbursts provide examples of each combination of RGB colors intersecting each other. (That is, red, green, and blue against black, plus red against green, green against blue, and blue against red.) Given that the most common sensor RGB color filter pattern (the so-called Bayer) pattern has twice as many green pixels as red or blue, you’ll generally see that the green/black starburst shows the best resolution, while the blue/red one shows the worst. The effects of different sensor geometries and color filter array patterns will be revealed here.

Musicians Image: Synthetic test patterns only tell you so much. While we have a lot of pictorial images in our other test targets, we thought it would be useful to include a small “natural” image here as well.

ISO Series
ISO 100 ISO 200 ISO 400 ISO 800 ISO 1,600
ISO 3,200 ISO 6,400 ISO 12.8K ISO 25.6K ISO 51.2K

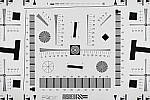
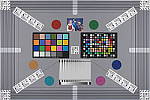
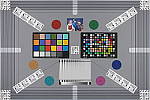
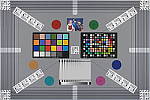
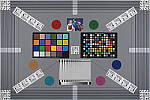
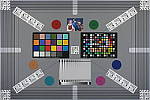
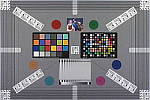
Resolution TargetSamsung NX500 Sample images image 3

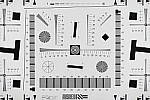
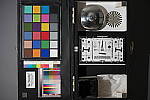
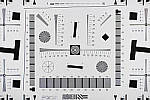
Part of the impetus in developing the new Multi Target in April 2009 was to switch to using a new 2x target for the resolution measurements, since the original ISO 12233 chart we’d used since the site first began in 1998(!) had become inadequate for testing the highest-resolution cameras. We’d for quite some time had a “homemade” 2x target, employing a shrunk version of the ISO 12233 chart, shot at 1/2 size. The resolution numbers on that chart all needed to be doubled to convert to the actual values, though, so we decided to go with a commercial 2x target to eliminate possible confusion on the part of our readers. Numbers on this new 2x resolution chart now read directly in hundreds of lines/picture height. (Because almost all of the area of this new resolution chart is now meaningful for resolution measurements, there was no longer space on it to overlay the MacBeth and other color targets on our prior Multi chart; hence the simultaneous change in our Multi target.)

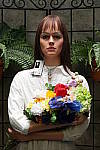
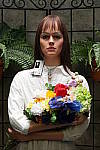
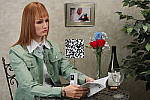
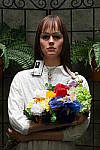
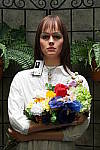
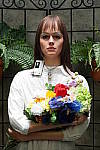
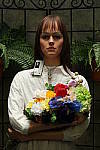
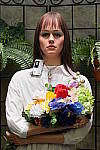
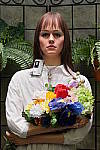
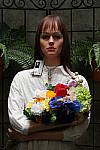
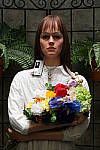
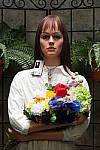
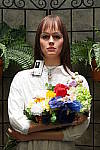
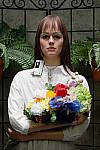
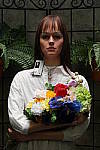
“Sunlit” Portrait:
(This is our “Outdoor” Portrait test – read more about it
here.)

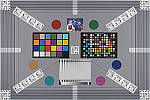
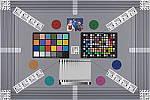
Samsung NX500 Sample images image 4

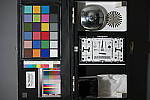
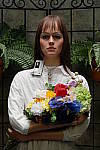
The lighting in this shot is deliberately awful, about what you’d expect from noontime sunshine here in the Atlanta, GA area. (In fact, the color balance has been chosen to pretty well match the hazy sunshine here in mid-August.)

The reason for the harsh lighting is to provide a real “torture
test” of how cameras handle conditions of extreme contrast; and in
particular, how well they do holding onto highlight detail.

Look for:

  • Overall color: Matching summer sunlight here in the South,
    the lighting in this scene is a bit more yellow-tinged than that in
    many parts of the country, or in the fall or winter. – So there may
    be an overall warm cast to the color. That said though, there’s a fair
    range of color represented in the bouquet, presenting a tough challenge
    for the cameras. For some reason, the blue flowers seem particularly
    hard to handle, with many cameras rendering them as purple. (In real
    life, they’re a light shade of navy blue, with just a bit of purple
    in them.)
  • Skin tones: The overall slight warm cast will tend to leave
    the model’s skin tones a bit on the warm side as well. Nonetheless,
    look to see if her skin seems overly pink or if they have a too-bright
    tinge of yellow: Some cameras oversaturate skin tones (make their color
    too intense), leading to an almost sunburned look. A little oversaturation
    can make for a more “healthy-looking” complexion, but it doesn’t
    take much variation for skin tones to look unnatural.
  • Highlight detail: When the model’s skin tones are at a more
    or less normal level of brightness, how much detail can you see in her
    shirt? Does it blow out entirely to white, or can you still see the
    creases and folds in the fabric?
  • Overall contrast: Most consumer digital cameras produce bright,
    contrasty images, because that’s what most consumers like. Unfortunately,
    under bright sunlit conditions, many such cameras produce images with
    little or no highlight detail, and dark, plugged-up looking shadows.
  • Shadow detail: The area under the flower bouquet is in quite deep shadow. Does the camera in question retain good detail here, with low image noise? To see, you may need to download the image and play with it in Photoshop(tm) or another imaging program. Brighten the image, and see how far detail extends into the shadows. Photo printers are generally much better at showing shadow detail than are CRTs or LCDs, so you’ll want a camera that preserves good detail here. The ability to boost brightness without encountering too much image noise is important if you ever have to “rescue” an underexposed image on the computer.
  • Detail in areas of subtle contrast: Most digital cameras employ
    some sort of noise-suppression to remove electronic noise from their
    images. Noise suppression is a good thing, but only if it’s not overdone.
    Too much noise suppression will “flatten out” subtle detail
    in areas of reduced contrast. You can often see this in hair, where
    the individual strands become blurred, and the image takes on an almost
    watercolor effect. Look at the detail in the model’s hair, and compare
    how it looks with different cameras in the Comparometer.

To view the entire exposure series from zero to +1.0 EV, see files NX500OUTMP0.HTM through NX500OUTBMP3.HTM on the thumbnail
index page
.

Dynamic Range
Off
Samsung NX500 Sample images image 5
SR+
Samsung NX500 Sample images image 6
HDR
Low
Samsung NX500 Sample images image 7
HDR
Med
Samsung NX500 Sample images image 8
HDR
High
Samsung NX500 Sample images image 9
Face Detection
Off
Samsung NX500 Sample images image 10
On
Samsung NX500 Sample images image 11
Auto
Samsung NX500 Sample images image 12

Indoor Portrait, Flash:

Normal
Flash
+1.0 EV
Samsung NX500 Sample images image 13
Slow-Sync
Flash
+0.0 EV
Samsung NX500 Sample images image 14

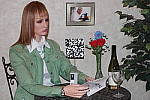
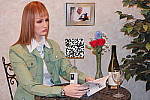
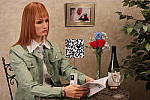
This shot duplicates indoor shooting conditions in most US homes, with
fairly bright incandescent room lighting. The challenge here is for the
camera’s flash to blend naturally with the room lighting, and produce
good, neutral color overall. – Some cameras will be overly affected by
the room lighting, even with their flash enabled, and the result will
be a strong orange cast. Another common failing is for the highlights
from the flash to take on an unnatural bluish cast.

Finally, exposure is important here, and frequently a tough challenge
for the cameras. The model’s white shirt is central in the scene, reflecting
a lot of the light from the flash right back at the camera. As a result,
most cameras underexpose this shot, and require some positive exposure
compensation to produce a good result. – And that’s an important consideration
in itself: Does the camera even permit adjustment of its flash
exposures? Many do not. These photos are a tough exposure challenge, if
they come out OK, the camera in question can probably be coaxed into delivering
a good flash exposure of any subject within its range.

Note too, that the normal flash shot (as opposed to the slow sync one,
if the camera offers that feature) will be sharply rendered, any subject
or camera movement frozen by the quick pop of the flash. That makes this
shot a good one to look for the effect of over-aggressive noise suppression
in the model’s hair.

To view the exposure series from zero to +1.0 EV in the normal flash mode, see files NX500INBFP0.HTM through /cameras/samsung-nx500-review/image/828812?section=samples on the thumbnail
index page
.

To view the same series in the Slow-Sync flash mode, see files /cameras/samsung-nx500-review/image/828810?section=samples through NX500INBFSP3.HTM on the thumbnail index
page
.

Indoor Portrait, No Flash:

Auto
White Balance
Samsung NX500 Sample images image 15
Incandescent
White Balance
Samsung NX500 Sample images image 16
Manual
White Balance
Samsung NX500 Sample images image 17

The incandescent lighting used in most US homes actually has a very
strong yellow color to it. Our eyes have an amazing ability to ignore
color casts like this, something digital cameras struggle to emulate.

The incandescent lighting used for this shot is thus not only very common
here in the US, but also very difficult for most digital cameras to deal
with. While we probably want a little yellow color to remain in
the image (to convey some of the mood of the original scene), too much
will look unnatural and distort colors.

Most cameras’ auto white balance systems have a great deal of difficulty
with this shot, but many incandescent white balance settings struggle
as well. (It seems that many cameras’ incandescent settings are actually
calibrated to the tungsten lighting used in professional studio systems,
which isn’t nearly as warm-toned as typical household lighting.)

If you intend to do much shooting indoors after dark, pay careful attention
to this test, as cameras vary widely in this regard.

To view the entire exposure series from zero to +1.0 EV, see files NX500INBMP0.HTM through NX500INBMP3.HTM on the thumbnail
index page
.

ISO Series:
“ISO equivalent” refers to a camera’s light sensitivity. ISO
200 represents twice the sensitivity of ISO 100, meaning that you can
use a shutter speed that’s twice as fast. Higher ISO settings are often
required to get any picture at all when shooting after dark, but even
in full daylight, using a higher ISO can help you freeze fast action.
The problem is, increasing a digital camera’s ISO also increases image
noise. In practical terms, this means that higher-ISO images often can’t
be used to produce prints as large as lower-ISO ones. The tricky thing
here is that high-ISO images often look much different when printed at
various sizes than they do when viewed on-screen. In particular, for any
level of image noise, you’ll often find that while noise is quite evident
at larger print sizes, as you reduce the size of the prints, there will
come a point where it suddenly ceases to be an issue. We routinely print
high-ISO photos from the cameras we test on our studio printer (currently
a Canon i9900) at a range of sizes, and report our findings. If you’re
interested in investigating the effect of image noise for yourself, don’t
judge cameras’ performance by how their images look on your CRT, viewed
pixel-for-pixel. Rather, download the test shots linked in the table below
and output them on your own printer, so you can see how prints of various
sizes will actually look.

One additional note about this particular test series though: Because
these images are shot under household incandescent lighting, the camera
has to boost its blue-channel signal quite a bit to get back to a neutral
color balance. Since the blue channel is generally the one with the most
noise, this makes this shot a real acid test of noise performance. Noise
levels in high-ISO shots taken under daylight conditions usually won’t
show as much noise. (See the “Far Field” test for examples of
high ISO shots captured in daylight.)

ISO
Series
ISO 100 ISO 200 ISO 400 ISO 800 ISO 1,600
ISO 3,200 ISO 6,400 ISO 12.8K ISO 25.6K ISO 51.2K

House Shot:

Samsung NX500 Sample images image 18

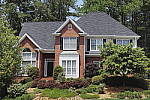
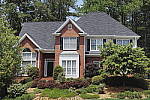
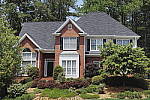
Like several of our tests, these images are actually photos of a high-resolution poster, shot under studio lighting. The shots for this camera were captured with our third-generation House poster, which was assembled from 45 separate 11-megapixel images, shot with a very high-quality lens, and then stitched together into a single image. The resulting image amounts to about 450 very high-quality megapixels. This should have sufficient detail to comfortably challenge cameras up to at least 80-100 megapixels. (And even with higher-resolution cameras, we believe that the camera lenses themselves would be more likely to limit resolution than would the detail in the poster.)

Why did we choose to shoot a picture of a picture? The idea was to show a typical subject (a house and surrounding foliage) in a way that would be absolutely consistent from camera to camera. Any outdoor subject is going to vary considerably from day to day, as the lighting changes with the weather, atmospheric conditions, and season. Shooting a poster lets us compare images from cameras shot weeks, months, or even years apart, with the sure knowledge that nothing has changed from one shot to another.

Things to look for here are fine detail, as seen in the foliage and tree limbs against the sky, sharpness in the corners, and the preservation of subtle detail in the shaded brick patterns. – Many cameras with overactive noise suppression severely blur the brick patterns that are in shadow.

Far-Field Test 2Samsung NX500 Sample images image 19

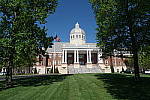
While the House poster in the shot above provides absolute repeatability from test to test, it doesn’t offer the range of brightness (dynamic range) that the original scene had, nor does it contain the nearly infinite range of fine detail found in nature. For these reasons, we shoot an outdoor photo of a building, to provide a more challenging (if more variable) subject for the cameras. Until Summer of 2011, we used the original house from the House poster for this “Far Field” shot, but the ever-encroaching trees made it less and less useful. The coup de grace for that subject was when the neighbor across the street relandscaped his yard so we could no longer shoot from our original position.

In place of the original house, we’ve switched to using the Roswell, GA City Hall building, which offers many of the elements of the original Far Field subject, but in a setting where we’re guaranteed access into the future, and without the threat of trees eventually obscuring the building. In this shot, we look at how the camera handles rendering of subtle detail (the bricks, both in the sunlight and in the deep shadows under the entryway roof), how it handles bright highlights (the white columns and reflections from the dome), and shadow detail (in the dark areas beneath the shrubs on either side of the steps).

Note though, that because this is shot outdoors, the character of the light is unavoidably going to change quite a bit, depending on the atmospheric humidity and the time of year. – You thus shouldn’t rely on it for absolute comparisons between cameras, since it’s unlikely that conditions will be exactly the same from one test to the next.

ISO
Series
ISO 100 ISO
200
ISO
400
ISO
800
ISO
1,600
ISO
3,200
ISO
6,400
Dynamic Range
Off
Samsung NX500 Sample images image 20
SR+
Samsung NX500 Sample images image 21
HDR Low
Samsung NX500 Sample images image 22
HDR Med
Samsung NX500 Sample images image 23
HDR High
Samsung NX500 Sample images image 24

Low-Light Tests

Low light photography is an area where there are really enormous differences between digital camera models. This test is now shot at three ISO settings, at a light level about equivalent to typical city street lighting at night (one foot-candle), and at 1/16 foot-candle. Shots in the rightmost column of the table below are taken with long exposure noise reduction disabled and high ISO noise reduction minimized. You may also see the effect of poor low-light autofocus in some of these shots, although we use a different test setup to check autofocus performance more directly. (The results of which are reported on in the main Test Results section.) Things to look for here include:

  • Exposure limit: What’s the darkest level a camera can handle
    at each ISO setting? If the leftmost images are reasonably bright, the
    camera should do fine with typical city night scenes. If you’re shooting
    in the more dimly-lit suburbs, you’ll need a camera capable of producing
    good images one, two, or three steps to the right of that.
  • Autofocus Limit: How dark can you shoot and still get well-focused
    pictures?
  • White Balance: Does the camera’s white balance suffer at low
    light levels? (Many do.)
  • Noise Levels: Look at the photos, print them on your own photo
    printer. How large a print can you make at acceptable quality levels,
    at various ISO settings and light levels?
  • Detail loss to anti-noise processing?: Do details in the white
    gauze and even in the lettering on the test targets suffer at lower
    light levels?

(Note: If you’d like to use a light meter to check light levels
for subjects you might be interested in shooting, a light level of one
foot-candle corresponds to a normal exposure of two seconds at f/2.8 and
ISO 100.)


1 fc
11 lux
1/16 fc
0.67 lux
1/16fc
No NR
ISO
100
Samsung NX500 Sample images image 25
2 s
f2.8
Samsung NX500 Sample images image 26
30 s
f2.8
Samsung NX500 Sample images image 27
30 s
f2.8
ISO
3200
Samsung NX500 Sample images image 28
1/15 s
f2.8
Samsung NX500 Sample images image 29
1 s
f2.8
Samsung NX500 Sample images image 30
1 s
f2.8
ISO
51200
Samsung NX500 Sample images image 31
1/250 s
f2.8
Samsung NX500 Sample images image 32
1/15 s
f2.8
Samsung NX500 Sample images image 33
1/15 s
f2.8

Manufacturer-Specified Flash Range

Lately, many manufacturers specify flash range with the camera set to Auto mode, in which the camera is free to boost its ISO setting to help increase the flash range. This does increase the range, but it’s easy to have too much of a good thing: Too high an ISO can leave you with too much image noise. The variable ISO setting also means that there isn’t an easy way to compare the range with the fixed-ISO shots in our standard flash range series. So now, we also test the flash under the manufacturer-specified conditions (whatever they may be, but frequently with the camera set to Auto mode), and the look at both how brightly the scene is lit, and how much image noise is present in the resulting images.

Flash range for SLRs will vary with the lens used (depending on the maximum aperture), so their flash range is commonly expressed as a Guide Number, or GN for short. The guide number is a distance, in either feet or meters, at a given ISO. To find the maximum flash range at a given aperture, just divide the guide number by the aperture. For instance, a guide number of 56 feet would translate to a range of 10 feet with a lens set to an aperture of f/5.6. The range would be twice that if you had an f/2.8 lens (56/2.8 = 20).


Manufacturer-Specified Flash Range
Samsung NX500 Sample images image 34
6.6 feet
ISO 200

Flash Uniformity

The flash units on many digital cameras don’t illuminate the scene very evenly, especially at wide angle focal lengths, so the photos here shows how uniform the flash coverage is. As noted earlier, this test uses the same target as our flash range test, but for the uniformity tests, we take care to frame the target the same from camera to camera. The concentric circles on the target mark distances 25%, 50%, and 75% of the way from the center to the corners. (Approximate, they roughly split the difference between the 4:3 and 3:2 aspect ratios.)

Flash Uniformity

Viewfinder Accuracy

Viewfinder accuracy is an important parameter, especially for shots
where framing is critical. The optical viewfinders on most digital cameras
match the (poor) accuracy of those on film cameras, typically showing
only about 85% of the actual final frame area. It’s likely that this is
a deliberate design choice by the camera engineers, to help avoid users
accidentally cutting off the heads of their subjects. We disagree with
this approach, or at least feel that it should be mitigated a bit, perhaps
by increasing the accuracy to 90 to 95%.

Unlike the optical viewfinders, the LCD viewfinders on most digital
cameras tend to be quite accurate. There are exceptions though, and it’s
unfortunately not uncommon to find an LCD monitor that only shows 90%
or less of the final frame.

Things to look for on this test chart are:

  • Optical/Electronic viewfinder accuracy: When we shoot this target in the studio, we line things up so the center of the bright red outline on the target is just visible at the edges of the viewfinder frame. The resulting photo then very directly shows how accurate the viewfinder is. The fine black lines mark progressive increments of 1% of increased or decreased frame area. The bold black lines mark 5% increments. The lines let you get an approximate idea of frame accuracy visually, but we measure the actual pixel dimensions to derive the accuracy numbers we report in our reviews.
  • LCD monitor accuracy: This is the same test, but framed with the LCD monitor instead of the optical viewfinder. As mentioned above, LCD monitors are usually more accurate than optical viewfinders, especially in point & shoot digicams.

Digital Cameras – Samsung NX500 Test Images

Not sure which camera to buy? Let your eyes be the ultimate judge!
Visit our Comparometer(tm)
to compare images from the Samsung NX500 with those from other
cameras you may be considering. The proof is in the pictures, so let
your own eyes decide which you like best!

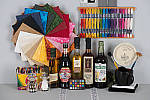
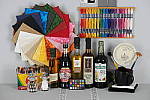
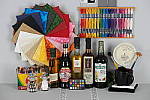
Still LifeSamsung NX500 Test Shots image 1

This is our new “Still Life” test target. We’re combining
some of the elements from previous shots (DaveBox and Res Chart) into
this and the “Multi Target” shot below, plus added a number
of elements that are very revealing of various camera characteristics
and foibles.

Here’s what to look for in this target:

  • Tone-on-tone detail & noise suppression:
    The cloth swatches in the pinwheel were chosen because they show a lot
    of tone-on-tone detail, across a broad range of colors. This is just
    the sort of detail that noise suppression processing tends to flatten
    out. If you look at the detail in these swatches as the ISO increases,
    you’ll see just where different cameras start to lose subtle detail.
    — The white and tan swatches and the dark swatches tend to be particularly
    revealing of this. The label of the vinegar bottle (second from the
    right) is another great place to look for lost detail from noise suppression,
    as the image of the person at the top of the label is actually a depiction
    of a mosaic. The dark colors in the background and in the figure’s clothes
    contain detail that’s very quickly lost when a camera’s noise suppression
    system kicks in. Cameras with really high-quality, low-noise sensors
    that require little noise suppression will be able to hold onto the
    detail in these areas, many others will show only a uniform swath of
    smudged color.

    Another place where you’ll quickly see the effects of over-aggressive
    noise suppression is in the white salt grains of the salt grinder in
    lower left. Cameras are often more conservative about suppressing noise
    in highlight areas (because our eyes tend to see less of it there),
    but many cameras seem to have a hard time holding onto the subtle shadings
    that distinguish the salt grains from each other, particularly at higher
    ISO levels.

  • Fine Detail: You’ll find a lot of fine detail
    in the label of the beer bottle on the right, in its fine cursive text,
    but the other bottle labels hold a lot of fine detail as well. Fine
    text is often a good visual indicator of resolution, because our brains
    have an excellent idea of what the text should look like, so
    are very quick to notice even minor loss of detail.

    For really fine detail, look to the circular scale/calculator on the
    right side of the scene. Some of the fine lines there are extremely
    fine indeed. Looking at results from many different cameras with this
    target, we found that camera noise-suppression systems often confuse
    the fine lines with image noise, and so flatten them out. There’s also
    a nice range of fine text sizes in this chart as well, once again great
    visual cues for resolution and detail.

  • Highlight Detail: Three elements in this scene
    show off (or show up) a camera’s ability to hold onto highlight detail.
    As mentioned above, the salt grains (and reflections of the studio lights)
    in the salt mill are examples of fairly subtle highlight detail that
    cameras’ anti-noise processing sometimes obliterate. The folded white
    cloth under the mug on the right side of the frame likewise shows a
    lot of white-on-white detail that is easy to lose, particularly if a
    camera’s tone curve is too contrasty. As it turns out though, the most
    sensitive test of a camera’s highlight abilities seems to be the hank
    of white embroidery thread in the upper right corner. These fibers are
    unusually bright and reflective, so its easy for a camera to blow out
    detail in them.

  • Shadow Detail: Several elements of this subject
    are useful for evaluating shadow detail, particularly the black mug
    and the pieces of folded black velvet, both under and inside the mug.
    The bottoms of the beer bottles also provide some gradations of deep
    shadow, and the clump of peppers in the bottom of the pepper oil bottle
    had a fair bit of detail that’s far down at the shadow end of the tone
    curve.

    We were actually surprised when we constructed this scene just how dark
    the velvet and sides of the beer bottles ended up being. Even with the
    bright studio lights shining directly on it, the velvet in particular
    stays way, way down at the shadow end of the tone curve. With most cameras
    and on most monitors, the velvet will simply appear as an unrelieved
    swatch of black. To see whether it contains deep detail or not, in most
    cases you’ll have to open the file in an image editor and boost the
    brightness dramatically, to bring the detail up into a visible range.

  • Preservation of “Shape” in Strong Colors:
    As you approach the extremes of a camera’s color gamut (its range of
    recordable colors), it becomes more and more difficult for the camera
    to show fine gradations of tone, because one or more of the RGB color
    channels are close to saturation. It’s not uncommon to see a brightly
    colored piece of clothing or a vibrant flower appear in digicam photos
    as just a blob of color, because the camera ran up against the limits
    of its color gamut. The brightly colored embroidery threads in the upper
    right portion of the Still Life target are good examples of situations
    where this might happen. Pay particular attention to the bright red
    and dark blue colors here, as these are both colors near the edge of
    the typical sRGB color gamut.

  • Color accuracy and white balance: It’s pretty
    small in there, but we’ve included a mini-MacBeth chart, which displays
    very carefully controlled color swatches. Our Multi Target (see below)
    sports a full-sized MacBeth chart, but the one here serves as a good
    check of color balance and rendition, and is also useful for checking
    white balance on this particular shot.

  • Image noise and detail vs ISO: As mentioned above,
    this target contains many elements useful for evaluating detail loss
    to anti-noise processing. We’ll therefore always shoot a full set of
    test images of this target across each camera’s ISO range, for every
    camera we test. (See below.)
ISO Series, High ISO NR = On (Default)
ISO 100 ISO 200 ISO 400 ISO 800 ISO
1,600
ISO 3,200 ISO 6,400 ISO 12.8K ISO 25.6K ISO 51.2K
ISO Series, High ISO NR = Off
ISO 100 ISO 200 ISO 400 ISO 800 ISO 1,600
ISO 3,200 ISO 6,400 ISO 12.8K ISO 25.6K ISO 51.2K

Multi TargetSamsung NX500 Test Shots image 2

Our new “Multi Target” was first put into use in April, 2009, replacing the earlier “interim” design. This target incorporates a number of elements that combine aspects of the previous Multi target, as well as the previous Viewfinder Accuracy or “VFA” chart. Here’s some of what you’ll find in this target:

Framing marks: This chart evolved from the earlier Viewfinder Accuracy chart, so one of its major uses is to measure viewfinder accuracy. (See notes in the Viewfinder Accuracy section, at the bottom of this page, for more information on this.)

USAF resolution targets: An important use of this target is in evaluating lens quality, looking how well sharpness holds up as you move from the center to the corners of the frame. The little “USAF” resolution targets arranged at the center, in the corners, and along the diagonals are very useful for making fine judgements about blur, flare and aberrations in the image. We generally show crops of a USAF chip from a corner of the target and from the center, to show how lenses hold sharpness at wide and telephoto focal lengths.

Alignment “bullseyes:” We find these graphics from the graphic arts world (used to align sheets of film in the old film-based prepress days) very useful for seeing chromatic aberration in lenses. The bold black/white elements are good for seeing the colored fringes caused by CA in the corners of the frame.

MacBeth ColorChecker Chart: This is about as common a color standard as you can get these days, very widely available for only mildly exorbitant cost, and quite well controlled in its production. It thus serves as a good basis of comparison between cameras and between test setups. Imatest also understands the MacBeth colors very well, and uses them to produce its color accuracy map that we feature in all our reviews.

MacBeth ColorChecker SG Chart: The ColorChecker SG chart provides a wider range of colors, to give a more detailed map of a camera’s color handling. We haven’t begun using this chart in the color-accuracy graphs we routinely offer, but expect to do so at some point in the future. In the meantime, we sometimes refer to this chart internally, to get a more complete idea of what a camera’s color map looks like.

Log C/F Target: The progressive resolution pattern located just below the center of the target is a Log C/F (logarithmic contrast vs spatial frequency) chart. Digital camera noise reduction routines work by looking at levels of local contrast, flattening-out detail at progressively lower spatial frequencies as the local contrast decreases. (This is very commonly seen in human hair, grass, foliage, and other subjects with subtly-contrasting fine detail.) This chart lets Imatest analyze just how a camera makes the tradeoff between contrast, detail, and image noise.

Color Starbursts: The six circular starburst elements arranged around the target are intended to reveal de-mosaicing artifacts and color-dependent resolution issues. The six starbursts provide examples of each combination of RGB colors intersecting each other. (That is, red, green, and blue against black, plus red against green, green against blue, and blue against red.) Given that the most common sensor RGB color filter pattern (the so-called Bayer) pattern has twice as many green pixels as red or blue, you’ll generally see that the green/black starburst shows the best resolution, while the blue/red one shows the worst. The effects of different sensor geometries and color filter array patterns will be revealed here.

Musicians Image: Synthetic test patterns only tell you so much. While we have a lot of pictorial images in our other test targets, we thought it would be useful to include a small “natural” image here as well.

ISO Series
ISO 100 ISO 200 ISO 400 ISO 800 ISO 1,600
ISO 3,200 ISO 6,400 ISO 12.8K ISO 25.6K ISO 51.2K

Resolution TargetSamsung NX500 Test Shots image 3

Part of the impetus in developing the new Multi Target in April 2009 was to switch to using a new 2x target for the resolution measurements, since the original ISO 12233 chart we’d used since the site first began in 1998(!) had become inadequate for testing the highest-resolution cameras. We’d for quite some time had a “homemade” 2x target, employing a shrunk version of the ISO 12233 chart, shot at 1/2 size. The resolution numbers on that chart all needed to be doubled to convert to the actual values, though, so we decided to go with a commercial 2x target to eliminate possible confusion on the part of our readers. Numbers on this new 2x resolution chart now read directly in hundreds of lines/picture height. (Because almost all of the area of this new resolution chart is now meaningful for resolution measurements, there was no longer space on it to overlay the MacBeth and other color targets on our prior Multi chart; hence the simultaneous change in our Multi target.)

“Sunlit” Portrait:
(This is our “Outdoor” Portrait test – read more about it
here.)

Samsung NX500 Test Shots image 4

The lighting in this shot is deliberately awful, about what you’d expect from noontime sunshine here in the Atlanta, GA area. (In fact, the color balance has been chosen to pretty well match the hazy sunshine here in mid-August.)

The reason for the harsh lighting is to provide a real “torture
test” of how cameras handle conditions of extreme contrast; and in
particular, how well they do holding onto highlight detail.

Look for:

  • Overall color: Matching summer sunlight here in the South,
    the lighting in this scene is a bit more yellow-tinged than that in
    many parts of the country, or in the fall or winter. – So there may
    be an overall warm cast to the color. That said though, there’s a fair
    range of color represented in the bouquet, presenting a tough challenge
    for the cameras. For some reason, the blue flowers seem particularly
    hard to handle, with many cameras rendering them as purple. (In real
    life, they’re a light shade of navy blue, with just a bit of purple
    in them.)
  • Skin tones: The overall slight warm cast will tend to leave
    the model’s skin tones a bit on the warm side as well. Nonetheless,
    look to see if her skin seems overly pink or if they have a too-bright
    tinge of yellow: Some cameras oversaturate skin tones (make their color
    too intense), leading to an almost sunburned look. A little oversaturation
    can make for a more “healthy-looking” complexion, but it doesn’t
    take much variation for skin tones to look unnatural.
  • Highlight detail: When the model’s skin tones are at a more
    or less normal level of brightness, how much detail can you see in her
    shirt? Does it blow out entirely to white, or can you still see the
    creases and folds in the fabric?
  • Overall contrast: Most consumer digital cameras produce bright,
    contrasty images, because that’s what most consumers like. Unfortunately,
    under bright sunlit conditions, many such cameras produce images with
    little or no highlight detail, and dark, plugged-up looking shadows.
  • Shadow detail: The area under the flower bouquet is in quite deep shadow. Does the camera in question retain good detail here, with low image noise? To see, you may need to download the image and play with it in Photoshop(tm) or another imaging program. Brighten the image, and see how far detail extends into the shadows. Photo printers are generally much better at showing shadow detail than are CRTs or LCDs, so you’ll want a camera that preserves good detail here. The ability to boost brightness without encountering too much image noise is important if you ever have to “rescue” an underexposed image on the computer.
  • Detail in areas of subtle contrast: Most digital cameras employ
    some sort of noise-suppression to remove electronic noise from their
    images. Noise suppression is a good thing, but only if it’s not overdone.
    Too much noise suppression will “flatten out” subtle detail
    in areas of reduced contrast. You can often see this in hair, where
    the individual strands become blurred, and the image takes on an almost
    watercolor effect. Look at the detail in the model’s hair, and compare
    how it looks with different cameras in the Comparometer.

To view the entire exposure series from zero to +1.0 EV, see files NX500OUTMP0.HTM through NX500OUTBMP3.HTM on the thumbnail
index page
.

Dynamic Range
Off
Samsung NX500 Test Shots image 5
SR+
Samsung NX500 Test Shots image 6
HDR
Low
Samsung NX500 Test Shots image 7
HDR
Med
Samsung NX500 Test Shots image 8
HDR
High
Samsung NX500 Test Shots image 9
Face Detection
Off
Samsung NX500 Test Shots image 10
On
Samsung NX500 Test Shots image 11
Auto
Samsung NX500 Test Shots image 12

Indoor Portrait, Flash:

Normal
Flash
+1.0 EV
Samsung NX500 Test Shots image 13
Slow-Sync
Flash
+0.0 EV
Samsung NX500 Test Shots image 14

This shot duplicates indoor shooting conditions in most US homes, with
fairly bright incandescent room lighting. The challenge here is for the
camera’s flash to blend naturally with the room lighting, and produce
good, neutral color overall. – Some cameras will be overly affected by
the room lighting, even with their flash enabled, and the result will
be a strong orange cast. Another common failing is for the highlights
from the flash to take on an unnatural bluish cast.

Finally, exposure is important here, and frequently a tough challenge
for the cameras. The model’s white shirt is central in the scene, reflecting
a lot of the light from the flash right back at the camera. As a result,
most cameras underexpose this shot, and require some positive exposure
compensation to produce a good result. – And that’s an important consideration
in itself: Does the camera even permit adjustment of its flash
exposures? Many do not. These photos are a tough exposure challenge, if
they come out OK, the camera in question can probably be coaxed into delivering
a good flash exposure of any subject within its range.

Note too, that the normal flash shot (as opposed to the slow sync one,
if the camera offers that feature) will be sharply rendered, any subject
or camera movement frozen by the quick pop of the flash. That makes this
shot a good one to look for the effect of over-aggressive noise suppression
in the model’s hair.

To view the exposure series from zero to +1.0 EV in the normal flash mode, see files NX500INBFP0.HTM through /cameras/samsung-nx500-review/image/828764?section=test on the thumbnail
index page
.

To view the same series in the Slow-Sync flash mode, see files /cameras/samsung-nx500-review/image/828762?section=test through NX500INBFSP3.HTM on the thumbnail index
page
.

Indoor Portrait, No Flash:

Auto
White Balance
Samsung NX500 Test Shots image 15
Incandescent
White Balance
Samsung NX500 Test Shots image 16
Manual
White Balance
Samsung NX500 Test Shots image 17

The incandescent lighting used in most US homes actually has a very
strong yellow color to it. Our eyes have an amazing ability to ignore
color casts like this, something digital cameras struggle to emulate.

The incandescent lighting used for this shot is thus not only very common
here in the US, but also very difficult for most digital cameras to deal
with. While we probably want a little yellow color to remain in
the image (to convey some of the mood of the original scene), too much
will look unnatural and distort colors.

Most cameras’ auto white balance systems have a great deal of difficulty
with this shot, but many incandescent white balance settings struggle
as well. (It seems that many cameras’ incandescent settings are actually
calibrated to the tungsten lighting used in professional studio systems,
which isn’t nearly as warm-toned as typical household lighting.)

If you intend to do much shooting indoors after dark, pay careful attention
to this test, as cameras vary widely in this regard.

To view the entire exposure series from zero to +1.0 EV, see files NX500INBMP0.HTM through NX500INBMP3.HTM on the thumbnail
index page
.

ISO Series:
“ISO equivalent” refers to a camera’s light sensitivity. ISO
200 represents twice the sensitivity of ISO 100, meaning that you can
use a shutter speed that’s twice as fast. Higher ISO settings are often
required to get any picture at all when shooting after dark, but even
in full daylight, using a higher ISO can help you freeze fast action.
The problem is, increasing a digital camera’s ISO also increases image
noise. In practical terms, this means that higher-ISO images often can’t
be used to produce prints as large as lower-ISO ones. The tricky thing
here is that high-ISO images often look much different when printed at
various sizes than they do when viewed on-screen. In particular, for any
level of image noise, you’ll often find that while noise is quite evident
at larger print sizes, as you reduce the size of the prints, there will
come a point where it suddenly ceases to be an issue. We routinely print
high-ISO photos from the cameras we test on our studio printer (currently
a Canon i9900) at a range of sizes, and report our findings. If you’re
interested in investigating the effect of image noise for yourself, don’t
judge cameras’ performance by how their images look on your CRT, viewed
pixel-for-pixel. Rather, download the test shots linked in the table below
and output them on your own printer, so you can see how prints of various
sizes will actually look.

One additional note about this particular test series though: Because
these images are shot under household incandescent lighting, the camera
has to boost its blue-channel signal quite a bit to get back to a neutral
color balance. Since the blue channel is generally the one with the most
noise, this makes this shot a real acid test of noise performance. Noise
levels in high-ISO shots taken under daylight conditions usually won’t
show as much noise. (See the “Far Field” test for examples of
high ISO shots captured in daylight.)

ISO
Series
ISO 100 ISO 200 ISO 400 ISO 800 ISO 1,600
ISO 3,200 ISO 6,400 ISO 12.8K ISO 25.6K ISO 51.2K

House Shot:

Samsung NX500 Test Shots image 18

Like several of our tests, these images are actually photos of a high-resolution poster, shot under studio lighting. The shots for this camera were captured with our third-generation House poster, which was assembled from 45 separate 11-megapixel images, shot with a very high-quality lens, and then stitched together into a single image. The resulting image amounts to about 450 very high-quality megapixels. This should have sufficient detail to comfortably challenge cameras up to at least 80-100 megapixels. (And even with higher-resolution cameras, we believe that the camera lenses themselves would be more likely to limit resolution than would the detail in the poster.)

Why did we choose to shoot a picture of a picture? The idea was to show a typical subject (a house and surrounding foliage) in a way that would be absolutely consistent from camera to camera. Any outdoor subject is going to vary considerably from day to day, as the lighting changes with the weather, atmospheric conditions, and season. Shooting a poster lets us compare images from cameras shot weeks, months, or even years apart, with the sure knowledge that nothing has changed from one shot to another.

Things to look for here are fine detail, as seen in the foliage and tree limbs against the sky, sharpness in the corners, and the preservation of subtle detail in the shaded brick patterns. – Many cameras with overactive noise suppression severely blur the brick patterns that are in shadow.

Far-Field Test 2Samsung NX500 Test Shots image 19

While the House poster in the shot above provides absolute repeatability from test to test, it doesn’t offer the range of brightness (dynamic range) that the original scene had, nor does it contain the nearly infinite range of fine detail found in nature. For these reasons, we shoot an outdoor photo of a building, to provide a more challenging (if more variable) subject for the cameras. Until Summer of 2011, we used the original house from the House poster for this “Far Field” shot, but the ever-encroaching trees made it less and less useful. The coup de grace for that subject was when the neighbor across the street relandscaped his yard so we could no longer shoot from our original position.

In place of the original house, we’ve switched to using the Roswell, GA City Hall building, which offers many of the elements of the original Far Field subject, but in a setting where we’re guaranteed access into the future, and without the threat of trees eventually obscuring the building. In this shot, we look at how the camera handles rendering of subtle detail (the bricks, both in the sunlight and in the deep shadows under the entryway roof), how it handles bright highlights (the white columns and reflections from the dome), and shadow detail (in the dark areas beneath the shrubs on either side of the steps).

Note though, that because this is shot outdoors, the character of the light is unavoidably going to change quite a bit, depending on the atmospheric humidity and the time of year. – You thus shouldn’t rely on it for absolute comparisons between cameras, since it’s unlikely that conditions will be exactly the same from one test to the next.

ISO
Series
ISO 100 ISO
200
ISO
400
ISO
800
ISO
1,600
ISO
3,200
ISO
6,400
Dynamic Range
Off
Samsung NX500 Test Shots image 20
SR+
Samsung NX500 Test Shots image 21
HDR Low
Samsung NX500 Test Shots image 22
HDR Med
Samsung NX500 Test Shots image 23
HDR High
Samsung NX500 Test Shots image 24

Low-Light Tests

Low light photography is an area where there are really enormous differences between digital camera models. This test is now shot at three ISO settings, at a light level about equivalent to typical city street lighting at night (one foot-candle), and at 1/16 foot-candle. Shots in the rightmost column of the table below are taken with long exposure noise reduction disabled and high ISO noise reduction minimized. You may also see the effect of poor low-light autofocus in some of these shots, although we use a different test setup to check autofocus performance more directly. (The results of which are reported on in the main Test Results section.) Things to look for here include:

  • Exposure limit: What’s the darkest level a camera can handle
    at each ISO setting? If the leftmost images are reasonably bright, the
    camera should do fine with typical city night scenes. If you’re shooting
    in the more dimly-lit suburbs, you’ll need a camera capable of producing
    good images one, two, or three steps to the right of that.
  • Autofocus Limit: How dark can you shoot and still get well-focused
    pictures?
  • White Balance: Does the camera’s white balance suffer at low
    light levels? (Many do.)
  • Noise Levels: Look at the photos, print them on your own photo
    printer. How large a print can you make at acceptable quality levels,
    at various ISO settings and light levels?
  • Detail loss to anti-noise processing?: Do details in the white
    gauze and even in the lettering on the test targets suffer at lower
    light levels?

(Note: If you’d like to use a light meter to check light levels
for subjects you might be interested in shooting, a light level of one
foot-candle corresponds to a normal exposure of two seconds at f/2.8 and
ISO 100.)


1 fc
11 lux
1/16 fc
0.67 lux
1/16fc
No NR
ISO
100
Samsung NX500 Test Shots image 25
2 s
f2.8
Samsung NX500 Test Shots image 26
30 s
f2.8
Samsung NX500 Test Shots image 27
30 s
f2.8
ISO
3200
Samsung NX500 Test Shots image 28
1/15 s
f2.8
Samsung NX500 Test Shots image 29
1 s
f2.8
Samsung NX500 Test Shots image 30
1 s
f2.8
ISO
51200
Samsung NX500 Test Shots image 31
1/250 s
f2.8
Samsung NX500 Test Shots image 32
1/15 s
f2.8
Samsung NX500 Test Shots image 33
1/15 s
f2.8

Manufacturer-Specified Flash Range

Lately, many manufacturers specify flash range with the camera set to Auto mode, in which the camera is free to boost its ISO setting to help increase the flash range. This does increase the range, but it’s easy to have too much of a good thing: Too high an ISO can leave you with too much image noise. The variable ISO setting also means that there isn’t an easy way to compare the range with the fixed-ISO shots in our standard flash range series. So now, we also test the flash under the manufacturer-specified conditions (whatever they may be, but frequently with the camera set to Auto mode), and the look at both how brightly the scene is lit, and how much image noise is present in the resulting images.

Flash range for SLRs will vary with the lens used (depending on the maximum aperture), so their flash range is commonly expressed as a Guide Number, or GN for short. The guide number is a distance, in either feet or meters, at a given ISO. To find the maximum flash range at a given aperture, just divide the guide number by the aperture. For instance, a guide number of 56 feet would translate to a range of 10 feet with a lens set to an aperture of f/5.6. The range would be twice that if you had an f/2.8 lens (56/2.8 = 20).


Manufacturer-Specified Flash Range
Samsung NX500 Test Shots image 34
6.6 feet
ISO 200

Flash Uniformity

The flash units on many digital cameras don’t illuminate the scene very evenly, especially at wide angle focal lengths, so the photos here shows how uniform the flash coverage is. As noted earlier, this test uses the same target as our flash range test, but for the uniformity tests, we take care to frame the target the same from camera to camera. The concentric circles on the target mark distances 25%, 50%, and 75% of the way from the center to the corners. (Approximate, they roughly split the difference between the 4:3 and 3:2 aspect ratios.)

Flash Uniformity

Viewfinder Accuracy

Viewfinder accuracy is an important parameter, especially for shots
where framing is critical. The optical viewfinders on most digital cameras
match the (poor) accuracy of those on film cameras, typically showing
only about 85% of the actual final frame area. It’s likely that this is
a deliberate design choice by the camera engineers, to help avoid users
accidentally cutting off the heads of their subjects. We disagree with
this approach, or at least feel that it should be mitigated a bit, perhaps
by increasing the accuracy to 90 to 95%.

Unlike the optical viewfinders, the LCD viewfinders on most digital
cameras tend to be quite accurate. There are exceptions though, and it’s
unfortunately not uncommon to find an LCD monitor that only shows 90%
or less of the final frame.

Things to look for on this test chart are:

  • Optical/Electronic viewfinder accuracy: When we shoot this target in the studio, we line things up so the center of the bright red outline on the target is just visible at the edges of the viewfinder frame. The resulting photo then very directly shows how accurate the viewfinder is. The fine black lines mark progressive increments of 1% of increased or decreased frame area. The bold black lines mark 5% increments. The lines let you get an approximate idea of frame accuracy visually, but we measure the actual pixel dimensions to derive the accuracy numbers we report in our reviews.
  • LCD monitor accuracy: This is the same test, but framed with the LCD monitor instead of the optical viewfinder. As mentioned above, LCD monitors are usually more accurate than optical viewfinders, especially in point & shoot digicams.

All test shots

Samsung NX500 Thumbnails

Not sure which camera to buy? Let your eyes be the ultimate judge!
Visit our Comparometer(tm)
to compare images from the Samsung NX500 with those from other
cameras you may be considering. The proof is in the pictures, so let
your own eyes decide which you like best!

This page may take a long time to load, due to the many thumbnails!

All images copyright © 2015 by The Imaging Resource. All rights reserved.

Samsung NX500 All test shots image 1
NX500FAR2HDR1.JPG
10,999,359 bytes
6480×4320
1/500 sec
f8.0
0.0 EV
32.0 mm focal length
ISO 100

Samsung NX500 All test shots image 2
Samsung NX500 All test shots image 3
NX500FAR2HDR2.JPG
10,882,491 bytes
6480×4320
1/500 sec
f8.0
0.0 EV
32.0 mm focal length
ISO 100
Samsung NX500 All test shots image 4
Samsung NX500 All test shots image 5
NX500FAR2HDR3.JPG
11,187,980 bytes
6480×4320
1/500 sec
f8.0
0.0 EV
32.0 mm focal length
ISO 100
Samsung NX500 All test shots image 6
Samsung NX500 All test shots image 7
NX500FAR2I0100.JPG
NX500FAR2I0100.SRW
10,656,587 bytes
6480×4320
1/500 sec
f8.0
0.0 EV
34.0 mm focal length
ISO 100
Samsung NX500 All test shots image 8
Samsung NX500 All test shots image 9
NX500FAR2I0200.JPG
NX500FAR2I0200.SRW
9,606,621 bytes
6480×4320
1/1000 sec
f8.0
0.0 EV
34.0 mm focal length
ISO 200
Samsung NX500 All test shots image 10
Samsung NX500 All test shots image 11
NX500FAR2I0400.JPG
NX500FAR2I0400.SRW
10,159,007 bytes
6480×4320
1/2000 sec
f8.0
0.0 EV
34.0 mm focal length
ISO 400
Samsung NX500 All test shots image 12
Samsung NX500 All test shots image 13
NX500FAR2I0800.JPG
NX500FAR2I0800.SRW
10,013,838 bytes
6480×4320
1/4000 sec
f8.0
0.0 EV
34.0 mm focal length
ISO 800
Samsung NX500 All test shots image 14
Samsung NX500 All test shots image 15
NX500FAR2I1600.JPG
NX500FAR2I1600.SRW
10,755,094 bytes
6480×4320
1/4000 sec
f11.0
0.0 EV
34.0 mm focal length
ISO 1600
Samsung NX500 All test shots image 16
Samsung NX500 All test shots image 17
NX500FAR2I3200.JPG
NX500FAR2I3200.SRW
11,787,264 bytes
6480×4320
1/4000 sec
f16.0
0.0 EV
34.0 mm focal length
ISO 3200
Samsung NX500 All test shots image 18
Samsung NX500 All test shots image 19
NX500FAR2I6400.JPG
NX500FAR2I6400.SRW
10,800,484 bytes
6480×4320
1/4000 sec
f22.0
0.0 EV
34.0 mm focal length
ISO 6400
Samsung NX500 All test shots image 20
Samsung NX500 All test shots image 21
NX500FAR2WTM.JPG
NX500FAR2WTM.SRW
7,165,087 bytes
6480×4320
1/500 sec
f8.0
0.0 EV
34.0 mm focal length
ISO 100
Samsung NX500 All test shots image 22
Samsung NX500 All test shots image 23
NX500FAR2WTT.JPG
NX500FAR2WTT.SRW
6,096,924 bytes
6480×4320
1/640 sec
f8.0
0.0 EV
50.0 mm focal length
ISO 100
Samsung NX500 All test shots image 24
Samsung NX500 All test shots image 25
NX500FAR2WTW.JPG
NX500FAR2WTW.SRW
4,858,088 bytes
6480×4320
1/250 sec
f8.0
0.0 EV
16.0 mm focal length
ISO 100
Samsung NX500 All test shots image 26
Samsung NX500 All test shots image 27
NX500FAR2_DR.JPG
10,567,365 bytes
6480×4320
1/640 sec
f8.0
0.0 EV
32.0 mm focal length
ISO 100
Samsung NX500 All test shots image 28
Samsung NX500 All test shots image 29
NX500FLFCW.JPG
5,659,843 bytes
6480×4320
1/30 sec
f3.5
0.0 EV
16.0 mm focal length
ISO 100
Samsung NX500 All test shots image 30
Samsung NX500 All test shots image 31
NX500FL_MFR066M0200.JPG
5,930,481 bytes
6480×4320
1/80 sec
f5.6
0.0 EV
50.0 mm focal length
ISO 200
Samsung NX500 All test shots image 32
Samsung NX500 All test shots image 33
NX500INBAP0.JPG
9,417,962 bytes
6480×4320
1/8 sec
f4.0
0.0 EV
60.0 mm focal length
ISO 200
Samsung NX500 All test shots image 34
Samsung NX500 All test shots image 35
NX500INBAP1.JPG
9,187,406 bytes
6480×4320
1/6 sec
f4.0
+0.3 EV
60.0 mm focal length
ISO 200
Samsung NX500 All test shots image 36
Samsung NX500 All test shots image 37
NX500INBAP2.JPG
9,520,482 bytes
6480×4320
1/5 sec
f4.0
+0.6 EV
60.0 mm focal length
ISO 200
Samsung NX500 All test shots image 38
Samsung NX500 All test shots image 39
NX500INBAP3.JPG
9,357,956 bytes
6480×4320
1/4 sec
f4.0
+1.0 EV
60.0 mm focal length
ISO 200
Samsung NX500 All test shots image 40
Samsung NX500 All test shots image 41
NX500INBFP0.JPG
9,303,156 bytes
6480×4320
1/100 sec
f4.0
0.0 EV
60.0 mm focal length
ISO 200
Samsung NX500 All test shots image 42
Samsung NX500 All test shots image 43
NX500INBFP1.JPG
9,279,716 bytes
6480×4320
1/100 sec
f4.0
0.0 EV
60.0 mm focal length
ISO 200
Samsung NX500 All test shots image 44
Samsung NX500 All test shots image 45
NX500INBFP2.JPG
9,492,778 bytes
6480×4320
1/100 sec
f4.0
0.0 EV
60.0 mm focal length
ISO 200
Samsung NX500 All test shots image 46
Samsung NX500 All test shots image 47
NX500INBFP3.JPG
9,231,650 bytes
6480×4320
1/100 sec
f4.0
0.0 EV
60.0 mm focal length
ISO 200
Samsung NX500 All test shots image 48
Samsung NX500 All test shots image 49
NX500INBFSP0.JPG
9,560,176 bytes
6480×4320
1/15 sec
f4.0
0.0 EV
60.0 mm focal length
ISO 200
Samsung NX500 All test shots image 50
Samsung NX500 All test shots image 51
NX500INBFSP1.JPG
9,318,596 bytes
6480×4320
1/15 sec
f4.0
0.0 EV
60.0 mm focal length
ISO 200
Samsung NX500 All test shots image 52
Samsung NX500 All test shots image 53
NX500INBFSP2.JPG
9,543,946 bytes
6480×4320
1/15 sec
f4.0
0.0 EV
60.0 mm focal length
ISO 200
Samsung NX500 All test shots image 54
Samsung NX500 All test shots image 55
NX500INBFSP3.JPG
9,167,634 bytes
6480×4320
1/15 sec
f4.0
0.0 EV
60.0 mm focal length
ISO 200
Samsung NX500 All test shots image 56
Samsung NX500 All test shots image 57
NX500INBI00100.JPG
NX500INBI00100.SRW
9,696,307 bytes
6480×4320
0.3 sec
f4.0
+0.3 EV
60.0 mm focal length
ISO 100
Samsung NX500 All test shots image 58
Samsung NX500 All test shots image 59
NX500INBI00200.JPG
NX500INBI00200.SRW
9,203,389 bytes
6480×4320
1/5 sec
f4.0
+0.3 EV
60.0 mm focal length
ISO 200
Samsung NX500 All test shots image 60
Samsung NX500 All test shots image 61
NX500INBI00400.JPG
NX500INBI00400.SRW
8,983,039 bytes
6480×4320
1/10 sec
f4.0
+0.3 EV
60.0 mm focal length
ISO 400
Samsung NX500 All test shots image 62
Samsung NX500 All test shots image 63
NX500INBI00800.JPG
NX500INBI00800.SRW
9,567,291 bytes
6480×4320
1/20 sec
f4.0
+0.3 EV
60.0 mm focal length
ISO 800
Samsung NX500 All test shots image 64
Samsung NX500 All test shots image 65
NX500INBI01600.JPG
NX500INBI01600.SRW
10,385,113 bytes
6480×4320
1/40 sec
f4.0
+0.3 EV
60.0 mm focal length
ISO 1600
Samsung NX500 All test shots image 66
Samsung NX500 All test shots image 67
NX500INBI03200.JPG
NX500INBI03200.SRW
10,960,201 bytes
6480×4320
1/80 sec
f4.0
+0.3 EV
60.0 mm focal length
ISO 3200
Samsung NX500 All test shots image 68
Samsung NX500 All test shots image 69
NX500INBI06400.JPG
NX500INBI06400.SRW
10,013,856 bytes
6480×4320
1/160 sec
f4.0
+0.3 EV
60.0 mm focal length
ISO 6400
Samsung NX500 All test shots image 70
Samsung NX500 All test shots image 71
NX500INBI12800.JPG
NX500INBI12800.SRW
12,479,158 bytes
6480×4320
1/320 sec
f4.0
+0.3 EV
60.0 mm focal length
ISO 12800
Samsung NX500 All test shots image 72
Samsung NX500 All test shots image 73
NX500INBI25600.JPG
NX500INBI25600.SRW
12,520,248 bytes
6480×4320
1/500 sec
f4.0
+0.3 EV
60.0 mm focal length
ISO 25600
Samsung NX500 All test shots image 74
Samsung NX500 All test shots image 75
NX500INBI51200.JPG
NX500INBI51200.SRW
13,426,123 bytes
6480×4320
1/1000 sec
f4.0
+0.3 EV
60.0 mm focal length
ISO 51200
Samsung NX500 All test shots image 76
Samsung NX500 All test shots image 77
NX500INBMP0.JPG
9,079,900 bytes
6480×4320
1/6 sec
f4.0
0.0 EV
60.0 mm focal length
ISO 200
Samsung NX500 All test shots image 78
Samsung NX500 All test shots image 79
NX500INBMP1.JPG
9,048,678 bytes
6480×4320
1/6 sec
f4.0
+0.3 EV
60.0 mm focal length
ISO 200
Samsung NX500 All test shots image 80
Samsung NX500 All test shots image 81
NX500INBMP2.JPG
9,199,065 bytes
6480×4320
1/5 sec
f4.0
+0.6 EV
60.0 mm focal length
ISO 200
Samsung NX500 All test shots image 82
Samsung NX500 All test shots image 83
NX500INBMP3.JPG
9,313,334 bytes
6480×4320
1/4 sec
f4.0
+1.0 EV
60.0 mm focal length
ISO 200
Samsung NX500 All test shots image 84
Samsung NX500 All test shots image 85
NX500INBTP0.JPG
8,799,547 bytes
6480×4320
1/8 sec
f4.0
0.0 EV
60.0 mm focal length
ISO 200
Samsung NX500 All test shots image 86
Samsung NX500 All test shots image 87
NX500INBTP1.JPG
9,048,448 bytes
6480×4320
1/6 sec
f4.0
+0.3 EV
60.0 mm focal length
ISO 200
Samsung NX500 All test shots image 88
Samsung NX500 All test shots image 89
NX500INBTP2.JPG
9,303,764 bytes
6480×4320
1/5 sec
f4.0
+0.6 EV
60.0 mm focal length
ISO 200
Samsung NX500 All test shots image 90
Samsung NX500 All test shots image 91
NX500INBTP3.JPG
9,411,696 bytes
6480×4320
1/4 sec
f4.0
+1.0 EV
60.0 mm focal length
ISO 200
Samsung NX500 All test shots image 92
Samsung NX500 All test shots image 93
NX500LL001003.JPG
NX500LL001003.SRW
7,933,412 bytes
6480×4320
2 sec
f2.8
0.0 EV
60.0 mm focal length
ISO 100
Samsung NX500 All test shots image 94
Samsung NX500 All test shots image 95
NX500LL001007.JPG
NX500LL001007.SRW
7,344,059 bytes
6480×4320
30 sec
f2.8
0.0 EV
60.0 mm focal length
ISO 100
Samsung NX500 All test shots image 96
Samsung NX500 All test shots image 97
NX500LL001007XNR.JPG
NX500LL001007XNR.SRW
7,385,979 bytes
6480×4320
30 sec
f2.8
0.0 EV
60.0 mm focal length
ISO 100
Samsung NX500 All test shots image 98
Samsung NX500 All test shots image 99
NX500LL032003.JPG
NX500LL032003.SRW
10,419,279 bytes
6480×4320
1/15 sec
f2.8
0.0 EV
60.0 mm focal length
ISO 3200
Samsung NX500 All test shots image 100
Samsung NX500 All test shots image 101
NX500LL032007.JPG
NX500LL032007.SRW
10,447,759 bytes
6480×4320
1 sec
f2.8
0.0 EV
60.0 mm focal length
ISO 3200
Samsung NX500 All test shots image 102
Samsung NX500 All test shots image 103
NX500LL032007XNR.JPG
NX500LL032007XNR.SRW
10,441,404 bytes
6480×4320
1 sec
f2.8
0.0 EV
60.0 mm focal length
ISO 3200
Samsung NX500 All test shots image 104
Samsung NX500 All test shots image 105
NX500LL512003.JPG
NX500LL512003.SRW
13,540,700 bytes
6480×4320
1/250 sec
f2.8
0.0 EV
60.0 mm focal length
ISO 51200
Samsung NX500 All test shots image 106
Samsung NX500 All test shots image 107
NX500LL512007.JPG
NX500LL512007.SRW
13,557,054 bytes
6480×4320
1/15 sec
f2.8
0.0 EV
60.0 mm focal length
ISO 51200
Samsung NX500 All test shots image 108
Samsung NX500 All test shots image 109
NX500LL512007XNR.JPG
NX500LL512007XNR.SRW
11,034,242 bytes
6480×4320
1/15 sec
f2.8
0.0 EV
60.0 mm focal length
ISO 51200
Samsung NX500 All test shots image 110
Samsung NX500 All test shots image 111
NX500MAC.JPG
13,151,160 bytes
6480×4320
1/60 sec
f8.0
0.0 EV
50.0 mm focal length
ISO 200
Samsung NX500 All test shots image 112
Samsung NX500 All test shots image 113
NX500MACFL.JPG
13,648,578 bytes
6480×4320
1/80 sec
f8.0
0.0 EV
50.0 mm focal length
ISO 200
Samsung NX500 All test shots image 114
Samsung NX500 All test shots image 115
NX500OUTBAP0.JPG
NX500OUTBAP0.SRW
7,380,228 bytes
4320×6480
1/40 sec
f8.0
0.0 EV
60.0 mm focal length
ISO 100
Samsung NX500 All test shots image 116
Samsung NX500 All test shots image 117
NX500OUTBAP1.JPG
NX500OUTBAP1.SRW
7,574,436 bytes
4320×6480
1/30 sec
f8.0
+0.3 EV
60.0 mm focal length
ISO 100
Samsung NX500 All test shots image 118
Samsung NX500 All test shots image 119
NX500OUTBAP2.JPG
NX500OUTBAP2.SRW
7,790,004 bytes
4320×6480
1/25 sec
f8.0
+0.6 EV
60.0 mm focal length
ISO 100
Samsung NX500 All test shots image 120
Samsung NX500 All test shots image 121
NX500OUTBAP3.JPG
NX500OUTBAP3.SRW
8,003,901 bytes
4320×6480
1/25 sec
f8.0
+1.0 EV
60.0 mm focal length
ISO 100
Samsung NX500 All test shots image 122
Samsung NX500 All test shots image 123
NX500OUTBDP0.JPG
7,349,324 bytes
4320×6480
1/40 sec
f8.0
0.0 EV
60.0 mm focal length
ISO 100
Samsung NX500 All test shots image 124
Samsung NX500 All test shots image 125
NX500OUTBDP1.JPG
7,651,674 bytes
4320×6480
1/30 sec
f8.0
+0.3 EV
60.0 mm focal length
ISO 100
Samsung NX500 All test shots image 126
Samsung NX500 All test shots image 127
NX500OUTBDP2.JPG
7,819,620 bytes
4320×6480
1/25 sec
f8.0
+0.6 EV
60.0 mm focal length
ISO 100
Samsung NX500 All test shots image 128
Samsung NX500 All test shots image 129
NX500OUTBDP3.JPG
7,957,707 bytes
4320×6480
1/20 sec
f8.0
+1.0 EV
60.0 mm focal length
ISO 100
Samsung NX500 All test shots image 130
Samsung NX500 All test shots image 131
NX500OUTBHDR1.JPG
8,694,091 bytes
4320×6480
1/40 sec
f8.0
0.0 EV
60.0 mm focal length
ISO 100
Samsung NX500 All test shots image 132
Samsung NX500 All test shots image 133
NX500OUTBHDR2.JPG
8,560,862 bytes
4320×6480
1/40 sec
f8.0
0.0 EV
60.0 mm focal length
ISO 100
Samsung NX500 All test shots image 134
Samsung NX500 All test shots image 135
NX500OUTBHDR3.JPG
8,513,687 bytes
4320×6480
1/40 sec
f8.0
0.0 EV
60.0 mm focal length
ISO 100
Samsung NX500 All test shots image 136
Samsung NX500 All test shots image 137
NX500OUTBMP0.JPG
7,319,294 bytes
4320×6480
1/40 sec
f8.0
0.0 EV
60.0 mm focal length
ISO 100
Samsung NX500 All test shots image 138
Samsung NX500 All test shots image 139
NX500OUTBMP1.JPG
7,356,608 bytes
4320×6480
1/30 sec
f8.0
+0.3 EV
60.0 mm focal length
ISO 100
Samsung NX500 All test shots image 140
Samsung NX500 All test shots image 141
NX500OUTBMP2.JPG
7,830,095 bytes
4320×6480
1/30 sec
f8.0
+0.6 EV
60.0 mm focal length
ISO 100
Samsung NX500 All test shots image 142
Samsung NX500 All test shots image 143
NX500OUTBMP3.JPG
8,085,676 bytes
4320×6480
1/25 sec
f8.0
+1.0 EV
60.0 mm focal length
ISO 100
Samsung NX500 All test shots image 144
Samsung NX500 All test shots image 145
NX500OUTB_AUTO.JPG
7,424,653 bytes
4320×6480
1/320 sec
f2.8
0.0 EV
60.0 mm focal length
ISO 100
Samsung NX500 All test shots image 146
Samsung NX500 All test shots image 147
NX500OUTB_FACE.JPG
7,150,070 bytes
4320×6480
1/40 sec
f8.0
0.0 EV
60.0 mm focal length
ISO 100
Samsung NX500 All test shots image 148
Samsung NX500 All test shots image 149
NX500OUTB_SR.JPG
7,506,335 bytes
4320×6480
1/60 sec
f8.0
0.0 EV
60.0 mm focal length
ISO 100
Samsung NX500 All test shots image 150
Samsung NX500 All test shots image 151
NX500hHOUSE.JPG
NX500hHOUSE.SRW
10,272,130 bytes
6480×4320
1/25 sec
f5.6
0.0 EV
60.0 mm focal length
ISO 100
Samsung NX500 All test shots image 152
Samsung NX500 All test shots image 153
NX500hRES.JPG
NX500hRES.SRW
5,430,092 bytes
6480×4320
1/40 sec
f5.6
0.0 EV
60.0 mm focal length
ISO 100
Samsung NX500 All test shots image 154
Samsung NX500 All test shots image 155
NX500hRES_ACRu250r03.JPG
9,075,111 bytes
6480×4320
1/40 sec
f5.6
0.0 EV
60.0 mm focal length
ISO 100
Samsung NX500 All test shots image 156
Samsung NX500 All test shots image 157
NX500hSLI00100NR0.JPG
NX500hSLI00100NR0.SRW
11,652,650 bytes
6480×4320
1/15 sec
f8.0
0.0 EV
60.0 mm focal length
ISO 100
Samsung NX500 All test shots image 158
Samsung NX500 All test shots image 159
NX500hSLI00100NR2D.JPG
NX500hSLI00100NR2D.SRW
11,380,461 bytes
6480×4320
1/15 sec
f8.0
0.0 EV
60.0 mm focal length
ISO 100
Samsung NX500 All test shots image 160
Samsung NX500 All test shots image 161
NX500hSLI00100_ACR.JPG
16,329,864 bytes
6480×4320
1/15 sec
f8.0
0.0 EV
60.0 mm focal length
ISO 100
Samsung NX500 All test shots image 162
Samsung NX500 All test shots image 163
NX500hSLI00100_ACRu250r03.JPG
17,608,794 bytes
6480×4320
1/15 sec
f8.0
0.0 EV
60.0 mm focal length
ISO 100
Samsung NX500 All test shots image 164
Samsung NX500 All test shots image 165
NX500hSLI00200NR0.JPG
NX500hSLI00200NR0.SRW
11,104,088 bytes
6480×4320
1/30 sec
f8.0
0.0 EV
60.0 mm focal length
ISO 200
Samsung NX500 All test shots image 166
Samsung NX500 All test shots image 167
NX500hSLI00200NR2D.JPG
NX500hSLI00200NR2D.SRW
11,126,171 bytes
6480×4320
1/30 sec
f8.0
0.0 EV
60.0 mm focal length
ISO 200
Samsung NX500 All test shots image 168
Samsung NX500 All test shots image 169
NX500hSLI00200_ACR.JPG
17,684,702 bytes
6480×4320
1/30 sec
f8.0
0.0 EV
60.0 mm focal length
ISO 200
Samsung NX500 All test shots image 170
Samsung NX500 All test shots image 171
NX500hSLI00400NR0.JPG
NX500hSLI00400NR0.SRW
10,898,432 bytes
6480×4320
1/60 sec
f8.0
0.0 EV
60.0 mm focal length
ISO 400
Samsung NX500 All test shots image 172
Samsung NX500 All test shots image 173
NX500hSLI00400NR2D.JPG
NX500hSLI00400NR2D.SRW
10,871,790 bytes
6480×4320
1/60 sec
f8.0
0.0 EV
60.0 mm focal length
ISO 400
Samsung NX500 All test shots image 174
Samsung NX500 All test shots image 175
NX500hSLI00400_ACR.JPG
19,813,078 bytes
6480×4320
1/60 sec
f8.0
0.0 EV
60.0 mm focal length
ISO 400
Samsung NX500 All test shots image 176
Samsung NX500 All test shots image 177
NX500hSLI00800NR0.JPG
NX500hSLI00800NR0.SRW
11,205,130 bytes
6480×4320
1/125 sec
f8.0
0.0 EV
60.0 mm focal length
ISO 800
Samsung NX500 All test shots image 178
Samsung NX500 All test shots image 179
NX500hSLI00800NR2D.JPG
NX500hSLI00800NR2D.SRW
11,182,058 bytes
6480×4320
1/125 sec
f8.0
0.0 EV
60.0 mm focal length
ISO 800
Samsung NX500 All test shots image 180
Samsung NX500 All test shots image 181
NX500hSLI00800_ACR.JPG
23,053,736 bytes
6480×4320
1/125 sec
f8.0
0.0 EV
60.0 mm focal length
ISO 800
Samsung NX500 All test shots image 182
Samsung NX500 All test shots image 183
NX500hSLI01600NR0.JPG
NX500hSLI01600NR0.SRW
11,561,796 bytes
6480×4320
1/250 sec
f8.0
0.0 EV
60.0 mm focal length
ISO 1600
Samsung NX500 All test shots image 184
Samsung NX500 All test shots image 185
NX500hSLI01600NR2D.JPG
NX500hSLI01600NR2D.SRW
11,561,564 bytes
6480×4320
1/250 sec
f8.0
0.0 EV
60.0 mm focal length
ISO 1600
Samsung NX500 All test shots image 186
Samsung NX500 All test shots image 187
NX500hSLI01600_ACR.JPG
27,520,531 bytes
6480×4320
1/250 sec
f8.0
0.0 EV
60.0 mm focal length
ISO 1600
Samsung NX500 All test shots image 188
Samsung NX500 All test shots image 189
NX500hSLI03200NR0.JPG
NX500hSLI03200NR0.SRW
12,126,105 bytes
6480×4320
1/500 sec
f8.0
0.0 EV
60.0 mm focal length
ISO 3200
Samsung NX500 All test shots image 190
Samsung NX500 All test shots image 191
NX500hSLI03200NR2D.JPG
NX500hSLI03200NR2D.SRW
12,127,319 bytes
6480×4320
1/500 sec
f8.0
0.0 EV
60.0 mm focal length
ISO 3200
Samsung NX500 All test shots image 192
Samsung NX500 All test shots image 193
NX500hSLI03200_ACR.JPG
31,818,325 bytes
6480×4320
1/500 sec
f8.0
0.0 EV
60.0 mm focal length
ISO 3200
Samsung NX500 All test shots image 194
Samsung NX500 All test shots image 195
NX500hSLI06400NR0.JPG
NX500hSLI06400NR0.SRW
12,807,176 bytes
6480×4320
1/1000 sec
f8.0
0.0 EV
60.0 mm focal length
ISO 6400
Samsung NX500 All test shots image 196
Samsung NX500 All test shots image 197
NX500hSLI06400NR2D.JPG
NX500hSLI06400NR2D.SRW
11,240,306 bytes
6480×4320
1/1000 sec
f8.0
0.0 EV
60.0 mm focal length
ISO 6400
Samsung NX500 All test shots image 198
Samsung NX500 All test shots image 199
NX500hSLI06400_ACR.JPG
36,939,922 bytes
6480×4320
1/1000 sec
f8.0
0.0 EV
60.0 mm focal length
ISO 6400
Samsung NX500 All test shots image 200
Samsung NX500 All test shots image 201
NX500hSLI12800NR0.JPG
NX500hSLI12800NR0.SRW
12,665,733 bytes
6480×4320
1/2000 sec
f8.0
0.0 EV
60.0 mm focal length
ISO 12800
Samsung NX500 All test shots image 202
Samsung NX500 All test shots image 203
NX500hSLI12800NR2D.JPG
NX500hSLI12800NR2D.SRW
12,654,351 bytes
6480×4320
1/2000 sec
f8.0
0.0 EV
60.0 mm focal length
ISO 12800
Samsung NX500 All test shots image 204
Samsung NX500 All test shots image 205
NX500hSLI12800_ACR.JPG
42,905,978 bytes
6480×4320
1/2000 sec
f8.0
0.0 EV
60.0 mm focal length
ISO 12800
Samsung NX500 All test shots image 206
Samsung NX500 All test shots image 207
NX500hSLI25600NR0.JPG
NX500hSLI25600NR0.SRW
10,355,644 bytes
6480×4320
1/3200 sec
f8.0
0.0 EV
60.0 mm focal length
ISO 25600
Samsung NX500 All test shots image 208
Samsung NX500 All test shots image 209
NX500hSLI25600NR2D.JPG
NX500hSLI25600NR2D.SRW
12,265,123 bytes
6480×4320
1/3200 sec
f8.0
0.0 EV
60.0 mm focal length
ISO 25600
Samsung NX500 All test shots image 210
Samsung NX500 All test shots image 211
NX500hSLI25600_ACR.JPG
47,631,164 bytes
6480×4320
1/3200 sec
f8.0
0.0 EV
60.0 mm focal length
ISO 25600
Samsung NX500 All test shots image 212
Samsung NX500 All test shots image 213
NX500hSLI51200NR0.JPG
NX500hSLI51200NR0.SRW
11,295,983 bytes
6480×4320
1/4000 sec
f10.0
0.0 EV
60.0 mm focal length
ISO 51200
Samsung NX500 All test shots image 214
Samsung NX500 All test shots image 215
NX500hSLI51200NR2D.JPG
NX500hSLI51200NR2D.SRW
14,707,396 bytes
6480×4320
1/4000 sec
f10.0
0.0 EV
60.0 mm focal length
ISO 51200
Samsung NX500 All test shots image 216
Samsung NX500 All test shots image 217
NX500hSLI51200_ACR.JPG
53,864,603 bytes
6480×4320
1/4000 sec
f10.0
0.0 EV
60.0 mm focal length
ISO 51200
Samsung NX500 All test shots image 218
Samsung NX500 All test shots image 219
NX500hVFAI00100.JPG
NX500hVFAI00100.SRW
9,112,181 bytes
6480×4320
1/30 sec
f5.6
0.0 EV
60.0 mm focal length
ISO 100
Samsung NX500 All test shots image 220
Samsung NX500 All test shots image 221
NX500hVFAI00200.JPG
NX500hVFAI00200.SRW
9,469,584 bytes
6480×4320
1/60 sec
f5.6
0.0 EV
60.0 mm focal length
ISO 200
Samsung NX500 All test shots image 222
Samsung NX500 All test shots image 223
NX500hVFAI00400.JPG
NX500hVFAI00400.SRW
9,755,825 bytes
6480×4320
1/125 sec
f5.6
0.0 EV
60.0 mm focal length
ISO 400
Samsung NX500 All test shots image 224
Samsung NX500 All test shots image 225
NX500hVFAI00800.JPG
NX500hVFAI00800.SRW
9,888,117 bytes
6480×4320
1/250 sec
f5.6
0.0 EV
60.0 mm focal length
ISO 800
Samsung NX500 All test shots image 226
Samsung NX500 All test shots image 227
NX500hVFAI01600.JPG
NX500hVFAI01600.SRW
10,690,680 bytes
6480×4320
1/500 sec
f5.6
0.0 EV
60.0 mm focal length
ISO 1600
Samsung NX500 All test shots image 228
Samsung NX500 All test shots image 229
NX500hVFAI03200.JPG
NX500hVFAI03200.SRW
12,190,583 bytes
6480×4320
1/1000 sec
f5.6
0.0 EV
60.0 mm focal length
ISO 3200
Samsung NX500 All test shots image 230
Samsung NX500 All test shots image 231
NX500hVFAI06400.JPG
NX500hVFAI06400.SRW
10,726,348 bytes
6480×4320
1/2000 sec
f5.6
0.0 EV
60.0 mm focal length
ISO 6400
Samsung NX500 All test shots image 232
Samsung NX500 All test shots image 233
NX500hVFAI12800.JPG
NX500hVFAI12800.SRW
13,054,567 bytes
6480×4320
1/4000 sec
f5.6
0.0 EV
60.0 mm focal length
ISO 12800
Samsung NX500 All test shots image 234
Samsung NX500 All test shots image 235
NX500hVFAI25600.JPG
NX500hVFAI25600.SRW
12,713,356 bytes
6480×4320
1/4000 sec
f7.1
0.0 EV
60.0 mm focal length
ISO 25600
Samsung NX500 All test shots image 236
Samsung NX500 All test shots image 237
NX500hVFAI51200.JPG
NX500hVFAI51200.SRW
12,969,150 bytes
6480×4320
1/4000 sec
f10.0
0.0 EV
60.0 mm focal length
ISO 51200
Samsung NX500 All test shots image 238
Samsung NX500 All test shots image 239
NX500hVFAL.JPG
9,134,111 bytes
6480×4320
1/30 sec
f5.6
0.0 EV
60.0 mm focal length
ISO 100
Samsung NX500 All test shots image 240
Samsung NX500 All test shots image 241
NX500hVFA_ADOBE.JPG
NX500hVFA_ADOBE.SRW
8,853,899 bytes
6480×4320
1/30 sec
f5.6
0.0 EV
60.0 mm focal length
ISO 100
Samsung NX500 All test shots image 242

All images copyright © 2015 by The Imaging Resource. All rights reserved.