Olympus E-3 Imatest Results
We routinely use Norman Koren's excellent "Imatest" analysis program for quantitative, thoroughly objective analysis of digicam test images. I highly recommend it to our technically-oriented readers, as it's far and away the best, most comprehensive analysis program I've found to date.
My comments below are just brief observations of what we see in the Imatest results. A full discussion of all the data Imatest produces is really beyond the scope of this review: Visit the Imatest web site for a full discussion of what the program measures, how it performs its computations, and how to interpret its output.
Here's some of the results produced by Imatest for the Olympus E-3:
(Note that data from competing cameras have been updated since the original E-3 review.)
sRGB Accuracy Comparison
 |
|||
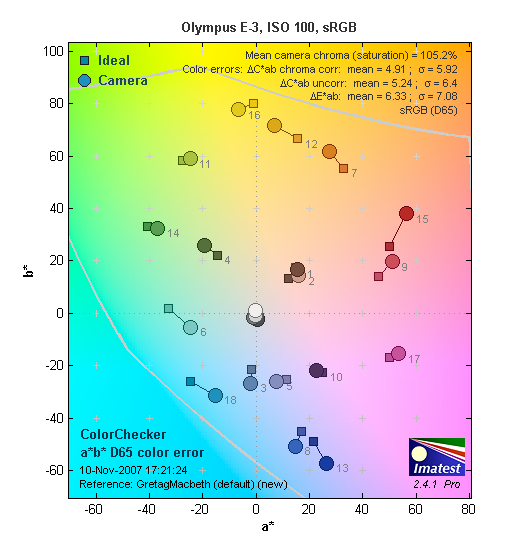
The Olympus E-3 showed good color accuracy, with the accurate saturation levels that we're accustomed to finding in Pro and semi-pro SLRs. Hue accuracy was very good, with most of the hue shift occurring in the cyans, sky blues, reds and oranges. Average saturation was 105.2% (oversaturated by 5.2%, mostly in the reds and blues). Average "delta-C" color error was only 4.91 after correction for saturation, making the E-3 one of the more hue-accurate cameras we've tested. (Delta-C is the same as the more commonly referred to delta-E, but delta-C takes into account only color differences, ignoring luminance variation.) All in all, a very good color response for an SLR. Mouse over the links below the illustration above to compare results with competing models.
Adobe RGB Accuracy Comparison
 |
|||
Using the Adobe RGB color space (which provides a much wider gamut, or range of colors that can be expressed), the Olympus E-3 delivers more highly saturated color, with an average saturation-corrected hue error of 4.81 "delta-C" units, and average saturation of 111.4%. Again, mouse over the links below the illustration above to compare results with competing models.
Color Analysis
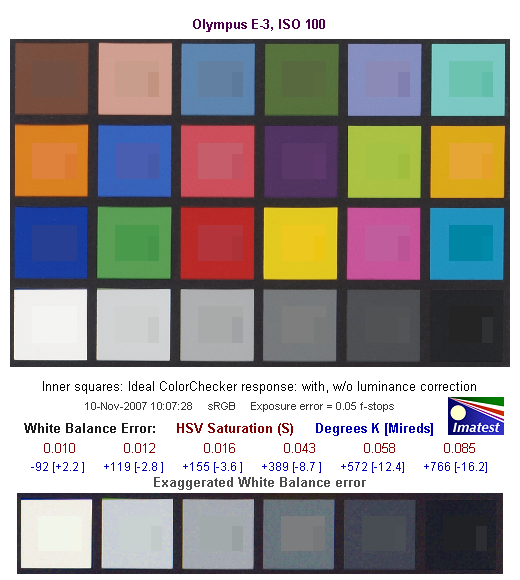
This image shows how the Olympus E-3 actually rendered the colors of the MacBeth chart, compared to a numerically ideal treatment. In each color swatch, the outer perimeter shows the color as actually captured by the camera, the inner square shows the numerically ideal color, after correcting for the luminance of the photographed chart (as determined by a second-order curve fit to the values of the gray swatches), and the small rectangle inside the inner square shows the numerically ideal color, without any luminance correction. This image shows the E-3's excellent hue accuracy, as well as its slight tendency to render some highly-saturated colors with higher luminance than the numerically "correct" level.
Gray Patch Tone and Noise Analysis
There's a lot in this particular graph, a lot more than we have room to go into here. (This set of plots has also changed a little in the more recent versions of Imatest. Some of the plots that were shown here previously are now shown in other Imatest output. Since we largely focus on the Noise Spectrum plot, we'll only show the graphic above, which includes that plot.) Bottom line, the Olympus E-3 noise levels are low at low ISO (although marginally higher than some competing cameras), with a frequency spectrum that has more energy on the higher frequency (right-hand) side of the curve than do many cameras.
In comparing these graphs with those from competing cameras, I've found that the Noise Spectrum graph at lower right is the most important. Cameras that manage to shift their noise spectrum to higher frequencies have much finer-grained noise structures, making their noise less visually objectionable. In the graph above, this would show up as a noise spectrum curve that remained higher on the right side, representing higher noise frequencies. The champion at this was the Canon EOS-1Ds Mark II, which produced remarkably fine-grained image noise, even at very high ISOs. The Olympus E-3 shows relatively low noise near zero frequency for the red, green and luminance channels, while the blue channel spikes higher, producing a little blotchiness in the blue channel. The overall noise curve has a fair bit of energy on the right-hand, high-frequency side, so what noise is present at low ISOs is for the most part very fine-grained.
Here's the same set of noise data at ISO 3,200. Here, the Noise Spectrum graph is shifted a quite a bit toward the left-hand, lower-frequency side than it was at ISO 100, coarsening the "grain" of the image noise patterns. Once again, not bad, but not a standout among recent competing DSLR models. (Interestingly, measured noise levels at ISO 3200 are almost dead-even with those of the Canon EOS-40D, but the E-3's images are visually much rougher, apparently due to the 40D's greater success at pushing the noise energy into the higher spatial frequency domain.)
This chart compares the Olympus E-3's noise performance over a range of ISOs against that of other cameras. While I continue to show noise plots of this sort because readers ask for them, I each time point out that the noise magnitude is only a small part of the story, the grain pattern being much more important. Here, we do see that E-3's noise magnitude is on average a little higher than the competition.
Olympus E-3 Dynamic Range Analysis
A key parameter in a digital camera is its Dynamic Range, the range of brightness that can be faithfully recorded. At the upper end of the tonal scale, dynamic range is dictated by the point at which the RGB data "saturates" at values of 255, 255, 255. At the lower end of the tonal scale, dynamic range is determined by the point at which there ceases to be any useful difference between adjacent tonal steps. Note the use of the qualifier "useful" in there: While it's tempting to evaluate dynamic range as the maximum number of tonal steps that can be discerned at all, that measure of dynamic range has very little relevance to real-world photography. What we care about as photographers is how much detail we can pull out of the shadows before image noise becomes too objectionable. This, of course, is a very subjective matter, and will vary with the application and even the subject matter in question. (Noise will be much more visible in subjects with large areas of flat tints and subtle shading than it would in subjects with strong, highly contrasting surface texture.)
What makes most sense then, is to specify useful dynamic range in terms of the point at which image noise reaches some agreed-upon threshold. To this end, Imatest computes a number of different dynamic range measurements, based on a variety of image noise thresholds. The noise thresholds are specified in terms of f-stops of equivalent luminance variation in the final image file, and dynamic range is computed for noise thresholds of 1.0 (low image quality), 0.5 (medium image quality), 0.25 (medium-high image quality) and 0.1 (high image quality). For most photographers and most applications, the noise thresholds of 0.5 and 0.25 f-stops are probably the most relevant to the production of acceptable-quality finished images, but many noise-sensitive shooters will insist on the 0.1 f-stop limit for their most critical work.
The image below shows the test results from Imatest for an in-camera JPEG file from the Olympus E-3 with a nominally-exposed density step target (Stouffer 4110), and the E-3's contrast setting at its default position.
The numbers here are a bit of a mixed bag. At first glance, the dynamic range spec at the highest quality threshold is only 6.42 stops, rather lackluster for a high-end DSLR. If you're willing to accept just a little more noise though, the numbers get a lot better, to the point that they're quite competitive with many DSLRs currently on the market..
Processing the E-3's RAW (ORF) files through Adobe Camera Raw (ACR) version 4.3 improved dynamic range by 0.8 stops at the highest quality level, and by 0.7 stop at the next-highest level. Results were similar with both ACR's automatic settings and when fiddling with the sliders manually, although (as is often the case) ACR's auto option did slightly better than I managed manually. The net result is pretty competitive: The results are ahead of those from other 4/3-format bodies we've tested, across the board, and at the "medium-high" quality level (allowing 1/4 stop of noise), the dynamic range is very competitive indeed.
Dynamic Range, the bottom line:
The net result was that the E-3 trailed much of its competition at the most stringent 1/10-stop noise threshold, but was very competitive at the 1/4-stop level. So if you don't mind a little noise in the shadows, the Olympus E-3 does very well indeed.
To get some perspective, here's a summary of the Olympus E-3's dynamic range performance, and how it compares to other digital SLRs that we also have Imatest dynamic range data for. (Results are arranged in order of decreasing dynamic range at the "High" quality level.):
| Dynamic Range (in f-stops) vs Image Quality (At camera's minimum ISO) |
||||
| Model | 1.0 (Low) |
0.5 (Medium) |
0.25 (Med-High) |
0.1 (High) |
| Fujifilm S3 Pro (Adobe Camera Raw 2) |
12.1 | 11.7 | 10.7 | 9.0 |
| Nikon D40x (Adobe Camera Raw 4.1) |
12.0 | 10.9 | 10.3 | 8.9 |
| Nikon D40 (Adobe Camera Raw 4.1) |
11.9 | 10.9 | 9.89 | 8.3 |
| Pentax K-100D (Adobe Camera Raw 3.6) |
11.3 | 10.3 | 9.51 | 8.23 |
| Pentax K10D (Adobe Camera Raw 3.7) |
10.6 | 10.0 | 9.29 | 8.19 |
| Canon EOS-1Ds Mark II (Adobe Camera Raw 3) |
11.2 | 10.3 | 9.4 | 8.14 |
| Nikon D40x | 10.8 | 10.0 | 9.42 | 8.04 |
| Fujifilm S3 Pro | -- | 9.9 | 9.4 | 7.94 |
| Canon Digital Rebel XTi (Adobe Camera Raw 3.6) |
10.8 | 9.88 | 9.18 | 7.84 |
| Canon EOS-5D (Adobe Camera Raw 3) |
11.0 | 10.4 | 9.21 | 7.83 |
| Canon EOS-40D (Adobe Camera Raw 4.2) |
11.2 | 10.1 | 9.26 | 7.72 |
| Canon EOS-5D (Camera JPEG) |
10.2 | 9.68 | 8.82 | 7.65 |
| Olympus E-3 (Adobe Camera Raw 4.3) |
10.3 | 10.1 | 9.29 | 7.64 |
| Nikon D200 (Adobe Camera Raw 3) |
10.6 | 9.65 | 8.96 | 7.61 |
| Nikon D80 (Adobe Camera Raw 3.6) |
11.1 | 10.4 | 9.42 | 7.51 |
| Olympus E510 (Adobe Camera Raw 4.1) |
10.0 | 9.43 | 8.64 | 7.46 |
| Pentax K10D | -- | 9.49 | 8.88 | 7.44 |
| Canon EOS-40D (Camera JPEG) |
10.6 | 9.52 | 8.78 | 7.42 |
| Nikon D50 | 10.7 | 9.93 | 8.70 | 7.36 |
| Canon EOS 20D | 10.3 | 9.66 | 8.85 | 7.29 |
| Nikon D40 | 10.4 | 9.8 | 8.89 | 7.28 |
| Nikon D80 (Camera JPEG) |
10.1 | 9.43 | 8.48 | 7.12 |
| Canon Digital Rebel XT | 10.3 | 9.51 | 8.61 | 7.11 |
| Nikon D200 (Camera JPEG) |
-- | 9.07 | 8.36 | 7.11 |
| Olympus EVOLT | 10.8 | 9.26 | 8.48 | 7.07 |
| Olympus E410 (Adobe Camera Raw 4.1) |
10.2 | 9.4 | 8.24 | 7.05 |
| Canon Digital Rebel XTi (Camera JPEG) |
9.83 | 9.10 | 8.27 | 7.04 |
| Canon EOS-1Ds Mark II (Camera JPEG) |
10.3 | 9.38 | 8.6 | 7.04 |
| Canon Digital Rebel | 10.1 | 9.11 | 8.47 | 6.97 |
| Panasonic DMC-L10 (Adobe Camera Raw 4.2) |
10.4 | 9.34 | 8.48 | 6.91 |
| Pentax *istDs | 10.2 | 10 | 8.87 | 6.9 |
| Pentax K-100D (Camera JPEG) |
10.3 | 9.3 | 8.39 | 6.73 |
| Nikon D2x | -- | 8.93 | 7.75 | 6.43 |
| Olympus E-3 (Camera JPEG) |
9.32 | 9.06 | 8.5 | 6.42 |
| Panasonic DMC-L10 | -- | 8.94 | 8.00 | 6.38 |
| Olympus E410 | -- | -- | 7.60 | 5.99 |
| Nikon D70s | 9.84 | 8.69 | 7.46 | 5.85 |
| Nikon D70 | 9.81 | 8.76 | 7.58 | 5.84 |
| Olympus E510 | 7.70 | 7.16 | 5.87 | 3.55 |
Long-time readers will know that I'm a little conflicted about the numbers in the table above, in that they haven't always correlated well with our experience of the various cameras' images: The Nikon D2x was a particular case in point. Its in-camera JPEGs tested very poorly, but we found loads of shadow detail in its images when we played with them in Photoshop. That said though, over the long haul, we've found that these results from Imatest track pretty well with what we find when working with the images themselves. In that vein, the "Medium-High" quality results for the Olympus E-3 seem to correlate well with what we found in Photoshop: There's more noise in the shadows than the best of its competitors provide, but if you're willing to accept some of that, its dynamic range is quite good, and definitely a long step up from Olympus' consumer-level 4/3-format DSLRs that we've tested to date.
Olympus E-3 Resolution Chart Test Results
The chart above shows consolidated results from spatial frequency response measurements in both the horizontal and vertical axes. The "MTF 50" numbers tend to correlate best with visual perceptions of sharpness, so those are what I focus on here. The uncorrected resolution figures are 2,023 line widths per picture height in the horizontal direction (corresponding to the vertically-oriented edge), and 2,003 lines along the vertical axis (corresponding to the horizontally-oriented edge), for a combined average of 2,013 LW/PH. Correcting to a "standardized" sharpening with a one-pixel radius results in an average of 1,943 LW/PH. This is just slightly below the uncorrected results, indicating very good but slightly overstated in-camera sharpening, with resolution results a bit below the best we've seen for a 10-megapixel camera.
To see what's going on, refer to the plots below, which show the actual edge profiles for both horizontal and vertical edges, in both their original and corrected forms. Here, you can see that there is in fact a little too much in-camera sharpening applied (the noticeable bump at the top ends of the black curves), that the standard sharpening operator partially corrects. While we didn't run the graphs to prove it, you'd likely do well to run the E-3 with slightly lower than default in-camera sharpening and the use strong/tight sharpening post-exposure in Photoshop or some other image editor.
 Fujifilm GFX 50S Review
 Fujifilm X-T3 Review
 Olympus E-M5 III Review

Follow Imaging Resource