Canon 5D Mark II Imatest Results
We routinely use Norman Koren's excellent "Imatest" analysis program for quantitative, thoroughly objective analysis of digicam test images. I highly recommend it to our technically-oriented readers, as it's far and away the best, most comprehensive analysis program I've found to date.
My comments below are just brief observations of what we see in the Imatest results. A full discussion of all the data Imatest produces is really beyond the scope of this review: Visit the Imatest web site for a full discussion of what the program measures, how it performs its computations, and how to interpret its output.
Here's some of the results produced by Imatest for the Canon 5D Mark II:
sRGB Accuracy Comparison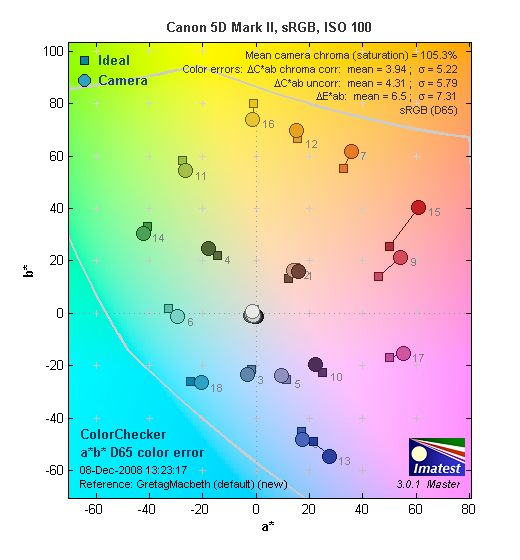 |
||||
The Canon 5D Mark II showed excellent color accuracy overall. Hue accuracy was exceptional, with only small shifts relative to mathematically correct colors Average saturation was 105.3% (oversaturated by only 5.3%, mostly in the deep blues and reds, with just a little in some greens). Average "delta-C" color error was only 3.94 after correction for saturation, which is very low, and the best score of the group. (Hard to say without exhaustive checking, but this may very well be the best delta-C score we've ever seen.) All in all, an excellent color response for an SLR. Mouse over the links below the illustration above to compare results with competing models.
Adobe RGB Accuracy Comparison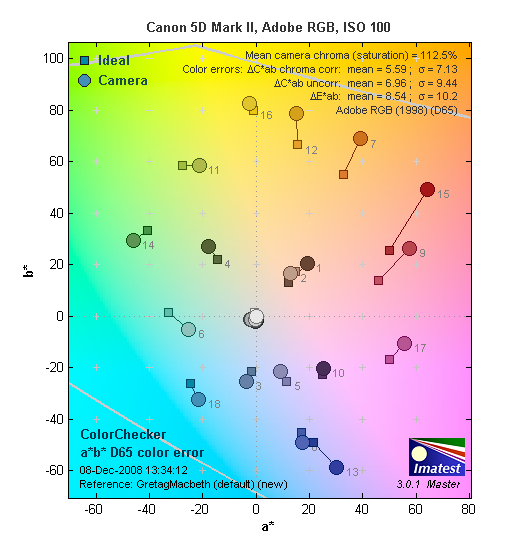 |
||||
Using the Adobe RGB color space (which provides a much wider gamut, or range of colors that can be expressed), the Canon 5D Mark II delivers more highly saturated color, with an average saturation of 112.5% and average saturation-corrected hue error of 5.59 "delta-C" units. These are good results, but not quite as good as sRGB. (We very commonly see some over-saturation in SLRs when shooting in the Adobe RGB space.) Again, mouse over the links below the illustration above to compare results with competing models.
Color Analysis
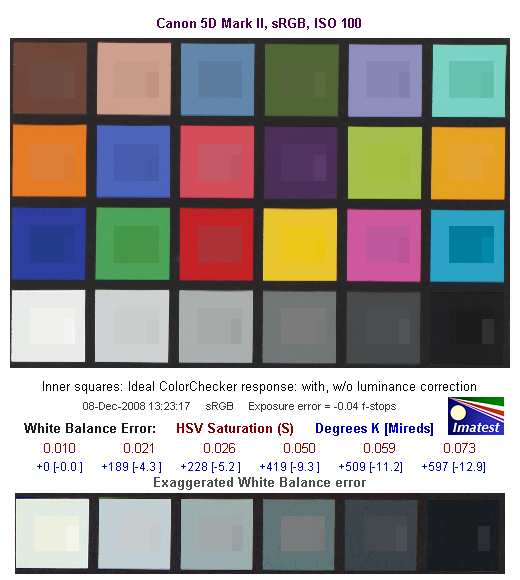
This image shows how the Canon 5D Mark II actually rendered the colors of the MacBeth chart, compared to a numerically ideal treatment. In each color swatch, the outer perimeter shows the color as actually captured by the camera, the inner square shows the numerically ideal color, after correcting for the luminance of the photographed chart (as determined by a second-order curve fit to the values of the gray swatches), and the small rectangle inside the inner square shows the numerically ideal color, without any luminance correction. This image shows the 5D Mark II's very good hue accuracy, as well as a gamma curve that results in an overexposure of some colors, notably cyans, reds, blues and some greens. (We've seen this in a wide range of cameras, increasing the "punch" of images by brightening saturated colors a little, while actually keeping both the hue and saturation level very close to technically accurate values.)
Noise Analysis
There's a lot in this particular graph, a lot more than we have room to go into here. (This set of plots has also changed a little in the more recent versions of Imatest. Some of the plots that were shown here previously are now shown in other Imatest output. Since we largely focus on the Noise Spectrum plot, we'll only show the graphic above, which includes that plot.)
In comparing these graphs with those from competing cameras, I've found that the Noise Spectrum graph at lower right is the most important. Cameras that manage to shift their noise spectrum to higher frequencies have much finer-grained noise structures, making their noise less visually objectionable. In the graph above, this would show up as a noise spectrum curve that remained higher on the right side, representing higher noise frequencies. The champion at this was (and still is) the Canon EOS-1Ds Mark II, which produced remarkably fine-grained image noise, even at very high ISOs.
Here, we see the results at ISO 50, which is as a low extension of the normal ISO range for the 5D Mark II. The luminance curve is fairly flat (meaning luminance noise is very fine-grained), however the color channels exhibit higher noise values, especially the blue and green channels at lower frequencies. (This is quite unusual, we more commonly see the green channel noise being the lowest, and the red noise curve tracking that of the blue channel more closely.) Still, overall noise levels are so low that the chroma noise was not noticeable except with extreme pixel peeping.
Here are the results at the 5D Mark II's base ISO of 100. Again, the luminance curve is quite flat and the 5D Mark II does a good job of keeping plenty of the noise energy at high frequencies. The RGBchannels are again higher than the luminance, especially the blue channel. Still, the Canon 5D Mark II noise levels are very low at low ISO (as you can see in the lower left graph, which shows noise levels vs target brightness), with a frequency spectrum that has more energy on the higher frequency (right-hand) side of the curve than do most cameras.
Above is the same set of noise data at ISO 3,200. Here, the luminance channel of the Noise Spectrum graph has a dramatic shift toward the left-hand, lower-frequency side than at ISO 100, coarsening the "grain" of the image noise patterns quite a bit. The color channels follow the luminance much more closely, except at the very low end of the frequency spectrum, no doubt due to the default noise reduction taking place. At this ISO, we see the red-channel noise becoming dominant at the lowest spatial frequencies, manifesting in the images (in combination with the blue channel noise) as red- to purple-colored splotchiness. Overall noise is still pretty low, however.
Here's the same set of noise data at ISO 6,400. Very similar to ISO 3,200, with a similar shift to the left indicating a coarser "grain" caused by the 5D Mark II's noise reduction attempts to blur out the noise. Note however the peak RMS noise (lower left chart) and Pixel noise (upper right) has jumped from about 0.12 to 0.2 f-stops and 2 to 3 % respectively.
Here's the same set of noise data at ISO 12,800. Very similar to ISO 6,400, with slightly more shift to the left indicating even coarser "grain". Note again the progressively higher noise levels in the lower left-hand and upper right-hand plots.
Here's the same set of noise data at ISO 25,600. Again, note the much higher noise levels.
This chart compares the Canon 5D Mark II's luminance noise performance over a range of ISOs against that of other current, full frame cameras, using default settings. While we continue to show noise plots of this sort because readers ask for them, we each time point out that the noise magnitude is only a small part of the story, the grain pattern being much more important. In the case of the Canon 5D Mark II, the magnitude of the image noise starts out about the same as the competition at ISO 50, then remains lower at all ISOs except when compared to the Nikon D700, where it's slightly higher below ISO 1600 and above ISO6400, however they follow one another fairly closely all the way to ISO 25,600. This is really a remarkable result considering how much smaller the 5D Mark II's photosites are compared to the D700's. Keep in mind these are at default settings, so the shape and positions of the curves will be influenced by your settings.
The graph above shows the luminance noise magnitude using the four levels of high-ISO noise reduction available on the Canon 5D Mark II. It's worth noting that while the "Low" setting doesn't seem to have much effect when looking at the chart, it is clear from the images that most of the noise reduction at the "Low" setting is happening to the chrominance channels.
All in all, the Canon 5D Mark II delivered some pretty spectacular noise levels, particularly considering its smaller pixel dimensions. Canon staff had told us that they felt the 5D Mark II's image quality is the highest of any camera they've produced to date, a fact certainly borne out in our tests.
Canon 5D Mark II Dynamic Range Analysis
A key parameter in a digital camera is its Dynamic Range, the range of brightness that can be faithfully recorded. At the upper end of the tonal scale, dynamic range is dictated by the point at which the RGB data "saturates" at values of 255, 255, 255. At the lower end of the tonal scale, dynamic range is determined by the point at which there ceases to be any useful difference between adjacent tonal steps. Note the use of the qualifier "useful" in there: While it's tempting to evaluate dynamic range as the maximum number of tonal steps that can be discerned at all, that measure of dynamic range has very little relevance to real-world photography. What we care about as photographers is how much detail we can pull out of the shadows before image noise becomes too objectionable. This, of course, is a very subjective matter, and will vary with the application and even the subject matter in question. (Noise will be much more visible in subjects with large areas of flat tints and subtle shading than it would in subjects with strong, highly contrasting surface texture.)
What makes most sense then, is to specify useful dynamic range in terms of the point at which image noise reaches some agreed-upon threshold. To this end, Imatest computes a number of different dynamic range measurements, based on a variety of image noise thresholds. The noise thresholds are specified in terms of f-stops of equivalent luminance variation in the final image file, and dynamic range is computed for noise thresholds of 1.0 (low image quality), 0.5 (medium image quality), 0.25 (medium-high image quality) and 0.1 (high image quality). For most photographers and most applications, the noise thresholds of 0.5 and 0.25 f-stops are probably the most relevant to the production of acceptable-quality finished images, but many noise-sensitive shooters will insist on the 0.1 f-stop limit for their most critical work.
The image below shows the test results from Imatest for an in-camera JPEG file from the Canon 5D Mark II with a nominally-exposed density step target (Stouffer 4110), and the 5D Mark II's Auto Lighting Optimizer function set to Off (the default is Standard).
These are very good results for in-camera JPEGs, near the top of the results from other recent SLRs we've tested. The tone curve shows excellent gradation in highlights, but the shadow end trails off a bit more abruptly.
Enabling ALO at its lowest setting improves the score just slightly, to 7.65 EV at the highest quality level, but overall dynamic range has dropped a bit from 10.9 EV to 10.6 EV. Interestingly, setting ALO to Low gave a more gradual approach to saturation in the highlights, but increasing it to Standard (see below) reduced this effect somewhat.
Increasing ALO a notch to its Standard setting improves the score just slightly again, to 7.66 EV at the highest quality, and overall dynamic range has increased back to 10.9 EV.
Increasing ALO to the maximum setting of Strong has little effect, actually reducing the highest quality score a bit, back to 7.65 EV.
Overall, given the relatively minor effect on the tone curve here, we suspect that the 5D's ALO function isn't being triggered by the particular (and unusual) distribution of tonality in the density step wedge used for this test.
Although the tone curve looks pretty good with Highlight Tone Priority enabled, the Imatest score is actually lower than with it disabled, because of the additional noise at ISO 200 (see the lower left plot), as well as the fact that more of the camera's available tonal range is being used to give the very flat tone curve in the highlights.
Our standard RAW converter (Adobe Camera Raw, version 5.2) was able to extract quite a bit more dynamic range (by almost 1.25 f-stop) than any of the in-camera JPEGs, with a score of 8.89 f-stops at the highest quality level. These are excellent results, as the Canon 5D Mark II's dynamic range score really benefits from ACR's default noise reduction. (Do note, though, that the level of manipulation done to achieve the results above will result in severe color artifacts on color images: This level of dynamic range is really only achievable on monochrome images.)
Dynamic Range, the bottom line:
The net result was that the 5D Mark II JPEGs came in near the top of most other DSLR models we've tested recently, and results from ACR processed RAW files were even better, only surpassed by a handful of others the highest quality level. An excellent performance.
To get some perspective, here's a summary of the Canon 5D Mark II's dynamic range performance, and how it compares to other digital SLRs that we also have Imatest dynamic range data for. (Results are arranged in order of decreasing dynamic range at the "High" quality level.):
| Dynamic Range (in f-stops) vs Image Quality (At camera's base ISO) (Blue = RAW via ACR, Yellow=Camera JPEG, Green=Current Camera) |
||||
| Model | 1.0 (Low) |
0.5 (Medium) |
0.25 (Med-High) |
0.1 (High) |
| Nikon D700 (Adobe Camera Raw 4.5) |
12.1 | 11.6 | 10.6 | 9.51 |
| Sony A900 (Adobe Camera Raw 4.6b) |
-- | 12.1 | 10.7 | 9.36 |
| Nikon D90 (Adobe Camera Raw 4.6b) |
12.1 | 11.8 | 10.7 | 9.27 |
| Fujifilm S3 Pro (Adobe Camera Raw 2) |
12.1 | 11.7 | 10.7 | 9.00 |
| Nikon D40x (Adobe Camera Raw 4.1) |
12.0 | 10.9 | 10.3 | 8.90 |
| Canon 5D Mark II (Adobe Camera Raw 5.2) |
-- | 10.8 | 10.0 | 8.89 |
| Canon EOS-1Ds Mark III (Adobe Camera Raw 4.5) |
11.5 | 10.7 | 9.96 | 8.84 |
| Nikon D3 (Adobe Camera Raw 4.5) |
11.7 | 11.0 | 10.0 | 8.75 |
| Canon EOS-1D Mark III (Adobe Camera Raw 4.5) |
11.7 | 10.7 | 9.99 | 8.73 |
| Pentax K20D (Adobe Camera Raw 4.5) |
11.4 | 10.6 | 9.82 | 8.56 |
| 8.5 Stops | ||||
| Nikon D300 (Adobe Camera Raw 4.3.1) |
11.4 | 10.9 | 9.87 | 8.45 |
| Sony A200 (Adobe Camera Raw 4.3.1) |
11.6 | 10.4 | 9.82 | 8.43 |
| Nikon D60 (Adobe Camera Raw 4.4.1) |
11.6 | 10.5 | 9.74 | 8.31 |
| Nikon D40 (Adobe Camera Raw 4.1) |
11.9 | 10.9 | 9.89 | 8.30 |
| Canon EOS-1Ds Mark III (Camera JPEG) |
10.9 | 10.2 | 9.71 | 8.23 |
| Pentax K100D (Adobe Camera Raw 3.6) |
11.3 | 10.3 | 9.51 | 8.23 |
| Pentax K200D (Adobe Camera Raw 4.4.1) |
-- | 10.5 | 9.54 | 8.19 |
| Pentax K10D (Adobe Camera Raw 3.7) |
10.6 | 10.0 | 9.29 | 8.19 |
| Sony A100 (Adobe Camera Raw 3.4) |
11.3 | 10.5 | 9.69 | 8.16 |
| Canon EOS-1Ds Mark II (Adobe Camera Raw 3) |
11.2 | 10.3 | 9.40 | 8.14 |
| Canon EOS 50D (Adobe Camera Raw 4.6) |
11.2 | 10.5 | 9.49 | 8.06 |
| Nikon D40x (Camera JPEG) |
10.8 | 10.0 | 9.42 | 8.04 |
| Canon Rebel XSi (Camera JPEG) (ALO on by default) |
11.3 | 10.1 | 9.34 | 8.01 |
| 8.0 Stops | ||||
| Fujifilm S3 Pro (Camera JPEG) |
-- | 9.90 | 9.40 | 7.94 |
| Sony A350 (Adobe Camera Raw 4.4) |
11.6 | 10.5 | 9.61 | 7.89 |
| Canon EOS-1D Mark III (Camera JPEG) |
-- | 10.2 | 9.70 | 7.88 |
| Canon Rebel XS (Adobe Camera Raw 4.5) |
-- | 10.3 | 9.27 | 7.88 |
| Nikon D3 (Camera JPEG) |
-- | -- | -- | 7.87 |
| Canon Digital Rebel XTi (Adobe Camera Raw 3.6) |
10.8 | 9.88 | 9.18 | 7.84 |
| Canon EOS 5D (Adobe Camera Raw 3) |
11.0 | 10.4 | 9.21 | 7.83 |
| Canon EOS 50D (Camera JPEG) (ALO Off ) |
-- | 9.64 | 9.17 | 7.83 |
| Nikon D90 (Camera JPEG) |
-- | -- | -- | 7.77 |
| Canon EOS 40D (Adobe Camera Raw 4.2) |
11.2 | 10.1 | 9.26 | 7.72 |
| Canon Rebel XSi (Adobe Camera Raw 4.4.1) |
10.6 | 9.95 | 9.10 | 7.68 |
| Canon EOS 50D (Camera JPEG) (ALO STD by default) |
-- | -- | 8.90 | 7.68 |
| Nikon D700 (Camera JPEG) |
-- | -- | 9.05 | 7.67 |
| Canon 5D Mark II (Camera JPEG) (ALO STD) |
10.6 | 9.68 | 8.98 | 7.66 |
| Canon EOS-5D (Camera JPEG) |
10.2 | 9.68 | 8.82 | 7.65 |
| Olympus E-3 (Adobe Camera Raw 4.3) |
10.3 | 10.1 | 9.29 | 7.64 |
| Canon 5D Mark II (Camera JPEG) (ALO Off) |
-- | 9.67 | 8.96 | 7.62 |
| Nikon D60 (Camera JPEG) |
10.5 | 9.62 | 8.89 | 7.62 |
| Nikon D200 (Adobe Camera Raw 3) |
10.6 | 9.65 | 8.96 | 7.61 |
| Nikon D80 (Adobe Camera Raw 3.6) |
11.1 | 10.4 | 9.42 | 7.51 |
| 7.5 Stops | ||||
| Olympus E-500 (Adobe Camera Raw 3) |
10.7 | 9.97 | 8.90 | 7.46 |
| Olympus E-510 (Adobe Camera Raw 4.1) |
10.0 | 9.43 | 8.64 | 7.46 |
| Pentax K10D (Camera JPEG) |
-- | 9.49 | 8.88 | 7.44 |
| Nikon D300 (Camera JPEG) |
-- | -- | 8.70 | 7.44 |
| Nikon D2Xs (Adobe Camera Raw 3.6) |
10.6 | 9.90 | 8.93 | 7.42 |
| Canon EOS 40D (Camera JPEG) |
10.6 | 9.52 | 8.78 | 7.42 |
| Nikon D50 (Camera JPEG) |
10.7 | 9.93 | 8.70 | 7.36 |
| Panasonic DMC-G1 (Adobe Camera Raw 5.2) |
10.7 | 9.78 | 8.70 | 7.32 |
| Sony A900 (Camera JPEG) (DRO off by default ) |
10.2 | 9.75 | 8.49 | 7.31 |
| Sony A200 (Camera JPEG) (DRO on by default) |
10.4 | 9.43 | 8.91 | 7.29 |
| Canon EOS 20D (Camera JPEG) |
10.3 | 9.66 | 8.85 | 7.29 |
| Canon EOS 30D (Camera JPEG) |
10.3 | 9.50 | 8.57 | 7.29 |
| Nikon D40 (Camera JPEG) |
10.4 | 9.80 | 8.89 | 7.28 |
| Sony A900 (Camera JPEG) (DRO on) |
10.1 | 9.76 | 8.47 | 7.26 |
| Canon Rebel XS (Camera JPEG) |
10.3 | 9.4 | 8.61 | 7.22 |
| Sony A350 (Camera JPEG) (DRO on by default) |
10.3 | 9.55 | 8.85 | 7.19 |
| Nikon D80 (Camera JPEG) |
10.1 | 9.43 | 8.48 | 7.12 |
| Canon Digital Rebel XT (Camera JPEG) |
10.3 | 9.51 | 8.61 | 7.11 |
| Nikon D200 (Camera JPEG) |
-- | 9.07 | 8.36 | 7.11 |
| Panasonic DMC-G1 (Camera JPEG, iExposure = Low) |
-- | 9.29 | 8.50 | 7.09 |
| Panasonic DMC-G1 (Camera JPEG, iExposure = Standard) |
-- | 9.30 | 8.54 | 7.07 |
| Olympus E-300 (Camera JPEG) |
10.8 | 9.26 | 8.48 | 7.07 |
| Olympus E-410 (Adobe Camera Raw 4.1) |
10.2 | 9.40 | 8.24 | 7.05 |
| Olympus E-500 (Camera JPEG) |
10.0 | 9.14 | 8.16 | 7.05 |
| Canon Digital Rebel XTi (Camera JPEG) |
9.83 | 9.10 | 8.27 | 7.04 |
| Canon EOS-1Ds Mark II (Camera JPEG) |
10.3 | 9.38 | 8.60 | 7.04 |
| Panasonic DMC-G1 (Camera JPEG, iExposure = High) |
10.3 | 9.23 | 8.54 | 7.04 |
| Panasonic DMC-G1 (Camera JPEG, iExposure = Off) |
-- | 9.33 | 8.52 | 7.03 |
| Pentax K200D (Camera JPEG) |
-- | 9.50 | 8.30 | 7.01 |
| 7.0 Stops | ||||
| Canon Digital Rebel (Camera JPEG) |
10.1 | 9.11 | 8.47 | 6.97 |
| Nikon D2Xs (Camera JPEG) |
9.82 | 8.98 | 8.23 | 6.97 |
| Panasonic DMC-L10 (Adobe Camera Raw 4.2) |
10.4 | 9.34 | 8.48 | 6.91 |
| Sigma DP1 (Camera JPEG) |
-- | 8.95 | 8.13 | 6.91 |
| Pentax *istDs (Camera JPEG) |
10.2 | 10.0 | 8.87 | 6.90 |
| Sony A100 (Camera JPEG) |
10.2 | 9.24 | 8.39 | 6.89 |
| Pentax K100D (Camera JPEG) |
10.3 | 9.30 | 8.39 | 6.73 |
| Pentax K20D (Camera JPEG) |
10.2 | 9.21 | 8.09 | 6.66 |
| 6.5 Stops | ||||
| Nikon D2x (Camera JPEG) |
-- | 8.93 | 7.75 | 6.43 |
| Olympus E-3 (Camera JPEG) |
9.32 | 9.06 | 8.50 | 6.42 |
| Panasonic DMC-L10 (Camera JPEG) |
-- | 8.94 | 8.00 | 6.38 |
| Olympus E-420 (Camera JPEG) |
9.18 | 8.82 | 7.93 | 6.37 |
| 6.0 Stops | ||||
| Olympus E-410 (Camera JPEG) |
-- | -- | 7.60 | 5.99 |
| Nikon D70s (Camera JPEG) |
9.84 | 8.69 | 7.46 | 5.85 |
| Nikon D70 (Camera JPEG) |
9.81 | 8.76 | 7.58 | 5.84 |
| < 5.0 Stops | ||||
| Olympus E-510 (Camera JPEG) |
7.70 | 7.16 | 5.87 | 3.55 |
The results shown in the table are interesting. One of the first things that struck me when I initially looked at test data for a wide range of d-SLRs, was that here again, purely analytical measurements don't necessarily correlate all that well with actual photographic experience. There's no question that the Fuji S3 Pro deserves its place atop the list, as its unique "SR" technology does indeed deliver a very obvious improvement in tonal range in the highlight portion of the tonal scale. I was surprised to see the analytical results place the Olympus E-300 as highly as they did, given that our sense of that camera's images was that they were in fact noisier than those of many other d-SLRs that we looked at. In the other direction, I was quite surprised to see the Nikon D2x place as low on the listings as it did, given that we found that camera's shadow detail to be little short of amazing.
One thing that's going on here though, is that we tested each camera at its lowest (base) ISO setting, which should produce best-case noise levels. This is in fact what many photographers will be most interested in, but it does perhaps place some of the Nikons (like the D40) at a disadvantage, as their lowest ISO setting is 200, as compared to the ISO 100 settings available on most other models.
With the preceding as caveats, what we can say about the Canon 5D Mark II's dynamic range is that it's quite good, but perhaps a third of a stop or so below the current best of the field. This roughly matches what we felt we were seeing in its images - It does a very good job, particularly with highlights, but plugs the very darkest shadows somewhat. - But keep in mind that we're splitting hairs, and talking about very deep shadows indeed.
Canon 5D Mark II Resolution Chart Test Results
The chart above shows consolidated results from spatial frequency response measurements in both the horizontal and vertical axes. The "MTF 50" numbers tend to correlate best with visual perceptions of sharpness, so those are what I focus on here. The uncorrected resolution figures are 2,529 line widths per picture height in the horizontal direction (corresponding to the vertically-oriented edge), and 2,587 lines along the vertical axis (corresponding to the horizontally-oriented edge), for a combined average of 2,558 LW/PH. Correcting to a "standardized" sharpening with a one-pixel radius increased both vertical and horizontal resolution, resulting in an average of 2,835 LW/PH, a little lower than you'd expect for a 21-megapixel camera.
To see what's going on, refer to the plots below, which show the actual edge profiles for both horizontal and vertical edges, in both their original and corrected forms. Here, you can see that there is fairly conservative in-camera sharpening applied (almost ideal bumps at the top ends, but no noticeable bumps at the bottom ends of the black edge profile curves). Imatest reports that the horizontal direction (vertical edge) is "undersharpened" by 4.68% while the vertical direction (horizontal edge) is undersharpened by 10.2%. Professionals and serious amateurs prefer this to oversharpening, and the 5D Mark II's images respond fairly well to the use of strong/tight sharpening post-exposure in Photoshop or some other image editor, although the over/undershoot shown in the profiles below does limit the sharpening that you can apply. (As usual, you should be able to extract a good bit more fine detail if you begin with a RAW file, rather than a JPEG.)
The over/undershoot in the profiles and the extent of its lateral spread underscores the minor exception we take to Imatest's definition of "optimal" sharpening: Imatest appears to be focusing (no pun intended) on the slope of the curve and the amount (height) of the overshoot, without considering its lateral extent. The 5D Mark II isn't bad in this regard, but the lateral extent of its sharpening artifacts does somewhat limit what you can do with sharpening in post-processing.
 Fujifilm GFX 50S Review
 Fujifilm X-T3 Review
 Olympus E-M5 III Review

Follow Imaging Resource