Samsung NX10 Imatest Results
We routinely use Norman Koren's excellent "Imatest" analysis program for quantitative, thoroughly objective analysis of digicam test images. I highly recommend it to our technically-oriented readers, as it's far and away the best, most comprehensive analysis program I've found to date.
Our comments below are just brief observations of what we see in the Imatest results. A full discussion of all the data Imatest produces is really beyond the scope of this review: Visit the Imatest web site for a full discussion of what the program measures, how it performs its computations, and how to interpret its output.
Here's some of the results produced by Imatest for the Samsung NX10:
sRGB Accuracy Comparison |
||||||
The Samsung showed good color accuracy, though default saturation levels are on the high side. Hue accuracy was good, with small to moderate hue shifts in reds, oranges, yellows and some aquas and purples. The larger shift in cyan are very common among the cameras we test; we think they're an effort to produce sky colors that look better on monitors and in print. Average "delta-C" color error was 5.79 after correction for saturation, which is good. (Delta-C is the same as the more commonly referred to delta-E, but delta-C takes into account only color differences, ignoring luminance variation.) Average saturation was 117.8% (oversaturated by only 17.8%), with most colors being mildly to moderately oversaturated. The NX10 undersaturates aqua and cyan a bit. All in all, a vibrant but fairly accurate color response for this class of camera. Mouse over the links below the illustration above to compare results with other recent consumer SLR and SLD cameras.
Adobe RGB Accuracy Comparison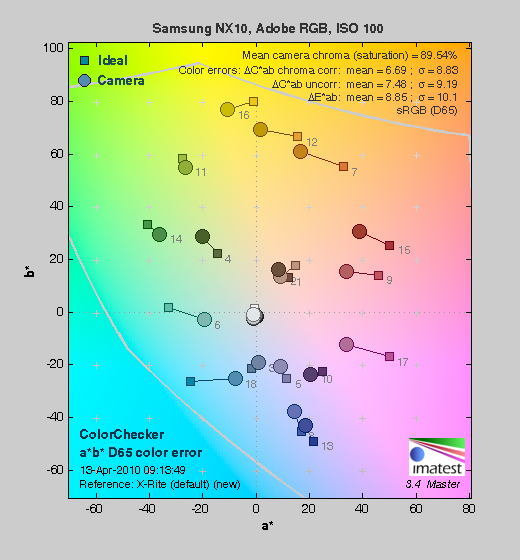 |
||||||
Here, unlike most SLDs and SLRs, when using the Adobe RGB color space (which provides a much wider gamut, or range of colors that can be expressed), the Samsung NX10 delivers undersaturated color. Average saturation was much lower at 89.54%, with an average saturation-corrected hue error of 6.69 "delta-C" units, less accurate than the sRGB result. Again, mouse over the links below the illustration above to compare results with the same group of potential competitors.
Samsung NX10 Color Analysis
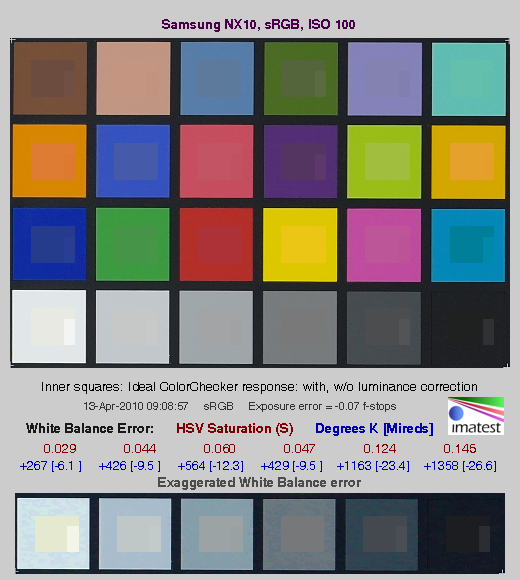
This image shows how the Samsung NX10 actually rendered the colors of the MacBeth chart, compared to a numerically ideal treatment. In each color swatch, the outer perimeter shows the color as actually captured by the camera, the inner square shows the numerically correct color after correcting for the luminance of the photographed chart (as determined by a second-order curve fit to the values of the gray swatches), and the small rectangle inside the inner square shows the numerically correct color, without the luminance correction. This image shows the generally good hue accuracy and high saturation. Here, you can see a slight greenish tinge in the bright yellow and orange swatches, something you can also see in the yellow yarn in our Still Life images. This seems to be a common occurrence these days, with Olympus and Panasonic cameras also showing similar shifts in these colors.
The bottom row of the chart shows exaggerated white balance errors, revealing that the camera produced a slightly blue/green color balance when using Custom white balance, with a WhiBal card as the reference. This would explain some of the slight color shifts above.
Samsung NX10 Noise Analysis
There's a lot in this particular graph, a lot more than we really have room to go into here. (This set of plots has also changed a few revisions back in Imatest. Some of the plots that were once shown here are now shown in other Imatest output. Since we largely focus on the Noise Spectrum plot, we only show the graphic above, which includes that plot.)
In comparing these graphs with those from competing cameras, we've found that the Noise Spectrum graph at lower right is the most important. Cameras that manage to shift their noise spectrum to higher frequencies have much finer-grained noise structures, making their noise less visually objectionable. In the graph above, this would show up as a noise spectrum curve that remained higher on the right side, representing higher noise frequencies.
The Samsung NX10 does a pretty good job of keeping a lot of the luminance noise energy (indicated by the black line) up at high frequencies. What little low-ISO luminance image noise that's there is fairly fine-grained as a result. Chroma noise at low spatial frequencies is higher than luminance noise, especially in the red channel, but this is not unusual, and the amount of low frequency chroma noise in the NX10's low-ISO images is on par or better than competing models.
Looking at the lower-left plot in the illustration above, the NX10's component noise levels are fairly evenly matched except for the red channel, which has higher levels at most exposure levels. RGBY RMS noise levels overall are somewhat higher than most other APS-C sensor cameras, though lower or similar to most Four-Thirds.
Above is the same set of noise data at ISO 1,600. Here, the Noise Spectrum graph is shifted toward the left-hand, lower-frequency side than it was at ISO 100, coarsening the "grain" of the image noise patterns quite a bit. The red and blue channels still exhibit a bit more noise at the low end of the frequency spectrum, but track luminance noise very closely at all but the lowest frequencies. Looking at the lower left graph again, RMS noise is a much higher than at ISO 100, as you'd expect.
Here's the same set of noise data at ISO 3,200. Here again, the Noise Spectrum graph is shifted even more toward the left-hand side, coarsening the "grain" of the image noise patterns further. Looking at the top-right plot, noise levels are lower than at ISO 1,600, a result of the camera's strong default high ISO noise reduction being applied. The additional noise reduction has also aligned the RGBY channels in the RMS noise plot at the lower left.
This chart compares the Samsung NX10's noise performance over a range of ISOs against that of other recent SLD models with smaller, Four-Thirds sensors. While we continue to show noise plots of this sort because readers ask for them, we each time point out that the noise magnitude is only a small part of the story, the grain pattern being much more important. Here, we can see that the Samsung's luminance noise magnitude graph shows significantly lower noise levels than the others up to ISO 800, where it is just a bit lower than average. At ISO 1,600, luminance noise is somewhat higher than the average in this group, but then falls to much lower than average at ISO 3,200, where the NX10's strong default high ISO noise reduction kicks in. The Samsung NX10 only offers one high ISO noise reduction option, which is On or Off at ISO 3,200. You cannot control the strength of noise reduction at any other ISO. The Off setting still applies NR at ISO 3,200, just not as strong as the On setting. The above data was collected using the default, On setting.
This chart compares the Samsung NX10's noise performance over a range of ISOs against that of other recent consumer SLRs. Here, we can see similar result in that the Samsung's luminance noise magnitude graph shows significantly lower noise levels than the others up to ISO 800, where it is just a bit lower than average. This is in part due to fairly strong default noise reduction. At ISO 1,600, luminance noise is the highest in this group, but then falls to about average at ISO 3,200, where the NX10's stronger default high ISO noise reduction kicks in.
Samsung NX10 Dynamic Range Analysis
A key parameter in a digital camera is its Dynamic Range, the range of brightness that can be faithfully recorded. At the upper end of the tonal scale, dynamic range is dictated by the point at which the RGB data "saturates" at values of 255, 255, 255. At the lower end of the tonal scale, dynamic range is determined by the point at which there ceases to be any useful difference between adjacent tonal steps. Note the use of the qualifier "useful" in there: While it's tempting to evaluate dynamic range as the maximum number of tonal steps that can be discerned at all, that measure of dynamic range has very little relevance to real-world photography. What we care about as photographers is how much detail we can pull out of the shadows before image noise becomes too objectionable. This, of course, is a very subjective matter, and will vary with the application and even the subject matter in question. (Noise will be much more visible in subjects with large areas of flat tints and subtle shading than it would in subjects with strong, highly contrasting surface texture.)
What makes most sense then, is to specify useful dynamic range in terms of the point at which image noise reaches some agreed-upon threshold. To this end, Imatest computes a number of different dynamic range measurements, based on a variety of image noise thresholds. The noise thresholds are specified in terms of f-stops of equivalent luminance variation in the final image file, and dynamic range is computed for noise thresholds of 1.0 (low image quality), 0.5 (medium image quality), 0.25 (medium-high image quality) and 0.1 (high image quality). For most photographers and most applications, the noise thresholds of 0.5 and 0.25 f-stops are probably the most relevant to the production of acceptable-quality finished images, but many noise-sensitive shooters will insist on the 0.1 f-stop limit for their most critical work.
The images below show the test results from Imatest for an in-camera JPEG file from the Samsung NX10 with a nominally-exposed density step target (Stouffer 4110), and the NX10's settings such as Contrast and Smart Range (Off) at their default positions.
Here, we can see that he tone curve shows pretty nice gradation in the highlights and the shadows. Total dynamic range was good at 10.4 f-stops, however the score at the highest level was quite low for an APS-C sensor, at only 5.88 f-stops.
Enabling the Samsung NX10's Smart Range feature increased total dynamic range slightly, from 10.4 to 10.7 f-stops, but dramatically increased scores at the higher quality levels. The score at the highest level increased almost a full stop, from 5.88 f-stops to 6.78 f-stops. This is despite the increase to ISO 200 (as required by Smart Range). The increase at the higher quality levels is likely due to the stronger noise reduction the NX10 applies to darker regions when Smart Range is enabled.
The illustrations above show the results from Adobe Camera Raw 5.7 beta, with Auto settings (slightly better results are likely possible with manually tweaking, but we weren't able to do better). As can be seen, the score at the highest quality level is much better than the camera JPEG at 7.91 vs 5.88 f-stops without Smart Range, about a 2 f-stop improvement. Compared to Smart Range, the score at the highest quality increased by about 1.1 f-stop. Total dynamic range actually decreased somewhat from 10.4 f-stops without Smart Range and 10.7 with, to 10.1 f-stops. It bears noting though, that extreme manipulation of RAW files to extend dynamic range can introduce severe color shifts in the resulting files: This dramatically increased dynamic range may only be really usable when converting the images to black and white. (As is the case with most cameras.) Also worth noting is that ACR's default noise reduction settings reduced the pixel noise (see the plot in the lower left-hand corner) a bit relative to the levels in the in-camera JPEG, which tends to shift scores towards the high quality category. Keep in mind we used a beta version of Adobe Camera Raw, as previous released versions did not support the Samsung NX10. This means that NX10 RAW conversion quality may improve with the released version, which could impact Imatest scores.
Dynamic Range, the bottom line:
The Samsung NX10's JPEG Imatest dynamic range scores performed rather poorly at the default settings. Enabling Smart Range was a big help, but the NX10 still scored below average for an APS-C sensor, and Smart Range does cause a decrease in detail in shadows, due to higher noise reduction. Dynamic range scores from ACR converted NX10 RAW files did much better than the JPEGs, but still scored a bit below average for a recent APS-C sensor.
To get some perspective, here's a summary of the Samsung NX10's dynamic range performance, and how it compares to other digital SLRs that we also have Imatest dynamic range data for. (Results are arranged in order of decreasing dynamic range at the "High" quality level.):
| Dynamic Range (in f-stops) vs Image Quality (At camera's base ISO) (Blue = RAW via ACR, Yellow=Camera JPEG, Green=Current Camera) |
||||
| Model | 1.0 (Low) |
0.5 (Medium) |
0.25 (Med-High) |
0.1 (High) |
| Nikon D3X (Adobe Camera Raw 5.3b) |
-- | -- | 11.1 | 9.64 |
| Nikon D3S (Adobe Camera Raw 5.6) |
-- | -- | 10.7 | 9.55 |
| Nikon D700 (Adobe Camera Raw 4.5) |
12.1 | 11.6 | 10.6 | 9.51 |
| Nikon D5000 (Adobe Camera Raw 5.4b) |
-- | 11.6 | 10.8 | 9.50 |
| Sony A900 (Adobe Camera Raw 4.6b) |
-- | 12.1 | 10.7 | 9.36 |
| Pentax K-x (Adobe Camera Raw 5.6b) |
11.5 | 11.2 | 10.7 | 9.33 |
| Nikon D90 (Adobe Camera Raw 4.6b) |
12.1 | 11.8 | 10.7 | 9.27 |
| Fujifilm S3 Pro (Adobe Camera Raw 2) |
12.1 | 11.7 | 10.7 | 9.00 |
| Sony A230 (Adobe Camera Raw 5.5) |
11.7 | 11.1 | 10.1 | 8.95 |
| Nikon D40x (Adobe Camera Raw 4.1) |
12.0 | 10.9 | 10.3 | 8.90 |
| Nikon D300S (Adobe Camera Raw 5.5) |
-- | 11.3 | 10.4 | 8.89 |
| Canon 5D Mark II (Adobe Camera Raw 5.2) |
-- | 10.8 | 10.0 | 8.89 |
| Sony A330 (Adobe Camera Raw 5.4) |
-- | -- | 10.1 | 8.86 |
| Canon EOS-1Ds Mark III (Adobe Camera Raw 4.5) |
11.5 | 10.7 | 9.96 | 8.84 |
| Nikon D3 (Adobe Camera Raw 4.5) |
11.7 | 11.0 | 10.0 | 8.75 |
| Canon EOS-1D Mark III (Adobe Camera Raw 4.5) |
11.7 | 10.7 | 9.99 | 8.73 |
| Sony A380 (Adobe Camera Raw 5.5) |
11.8 | 10.9 | 10.1 | 8.62 |
| Nikon D3000 (Adobe Camera Raw 5.5) |
-- | 10.8 | 10.1 | 8.61 |
| Pentax K20D (Adobe Camera Raw 4.5) |
11.4 | 10.6 | 9.82 | 8.56 |
| 8.5 Stops | ||||
| Nikon D300 (Adobe Camera Raw 4.3.1) |
11.4 | 10.9 | 9.87 | 8.45 |
| Sony A200 (Adobe Camera Raw 4.3.1) |
11.6 | 10.4 | 9.82 | 8.43 |
| Nikon D60 (Adobe Camera Raw 4.4.1) |
11.6 | 10.5 | 9.74 | 8.31 |
| Nikon D40 (Adobe Camera Raw 4.1) |
11.9 | 10.9 | 9.89 | 8.30 |
| Canon EOS-1Ds Mark III (Camera JPEG) |
10.9 | 10.2 | 9.71 | 8.23 |
| Pentax K100D (Adobe Camera Raw 3.6) |
11.3 | 10.3 | 9.51 | 8.23 |
| Pentax K200D (Adobe Camera Raw 4.4.1) |
-- | 10.5 | 9.54 | 8.19 |
| Pentax K10D (Adobe Camera Raw 3.7) |
10.6 | 10.0 | 9.29 | 8.19 |
| Canon 7D (Adobe Camera Raw 5.6) |
11.2 | 10.3 | 9.52 | 8.18 |
| Sony A100 (Adobe Camera Raw 3.4) |
11.3 | 10.5 | 9.69 | 8.16 |
| Canon EOS-1Ds Mark II (Adobe Camera Raw 3) |
11.2 | 10.3 | 9.40 | 8.14 |
| Canon EOS 50D (Adobe Camera Raw 4.6) |
11.2 | 10.5 | 9.49 | 8.06 |
| Nikon D40x (Camera JPEG) |
10.8 | 10.0 | 9.42 | 8.04 |
| Olympus E-P1 (ISO 200, Adobe Camera Raw 5.5) |
11.5 | 10.4 | 9.26 | 8.04 |
| Canon Rebel XSi (Camera JPEG) (ALO on by default) |
11.3 | 10.1 | 9.34 | 8.01 |
| 8.0 Stops | ||||
| Nikon D3S (Camera JPEG) |
-- | -- | -- | 7.96 |
| Fujifilm S3 Pro (Camera JPEG) |
-- | 9.90 | 9.40 | 7.94 |
| Samsung NX10 (Adobe Camera Raw 5.7 beta) |
-- | -- | 9.18 | 7.91 |
| Sony A350 (Adobe Camera Raw 4.4) |
11.6 | 10.5 | 9.61 | 7.89 |
| Canon EOS-1D Mark III (Camera JPEG) |
-- | 10.2 | 9.70 | 7.88 |
| Olympus E-P2 (Adobe Camera Raw 5.6) |
-- | 10.2 | 9.44 | 7.88 |
| Canon Rebel XS (Adobe Camera Raw 4.5) |
-- | 10.3 | 9.27 | 7.88 |
| Nikon D3 (Camera JPEG) |
-- | -- | -- | 7.87 |
| Canon Digital Rebel XTi (Adobe Camera Raw 3.6) |
10.8 | 9.88 | 9.18 | 7.84 |
| Canon EOS 5D (Adobe Camera Raw 3) |
11.0 | 10.4 | 9.21 | 7.83 |
| Nikon D90 (Camera JPEG) |
-- | -- | -- | 7.77 |
| Panasonic DMC-GH1 (Adobe Camera Raw 5.4b) |
9.88 | -- | 9.30 | 7.76 |
| Canon Rebel T1i (Adobe Camera Raw 5.4b) |
11.2 | 10.2 | 9.16 | 7.73 |
| Pentax K-7 (Adobe Camera Raw 5.4) |
10.6 | 9.93 | 9.07 | 7.73 |
| Canon EOS 40D (Adobe Camera Raw 4.2) |
11.2 | 10.1 | 9.26 | 7.72 |
| Panasonic DMC-GH1 (Camera JPEG) |
8.77 | -- | -- | 7.70 |
| Canon Rebel XSi (Adobe Camera Raw 4.4.1) |
10.6 | 9.95 | 9.10 | 7.68 |
| Canon EOS 50D (Camera JPEG) (ALO STD by default) |
-- | -- | 8.90 | 7.68 |
| Nikon D700 (Camera JPEG) |
-- | -- | 9.05 | 7.67 |
| Canon 5D Mark II (Camera JPEG) (ALO STD by default) |
10.6 | 9.68 | 8.98 | 7.66 |
| Nikon D5000 (Camera JPEG) |
-- | -- | 8.96 | 7.65 |
| Canon EOS-5D (Camera JPEG) |
10.2 | 9.68 | 8.82 | 7.65 |
| Olympus E-3 (Adobe Camera Raw 4.3) |
10.3 | 10.1 | 9.29 | 7.64 |
| Nikon D60 (Camera JPEG) |
10.5 | 9.62 | 8.89 | 7.62 |
| Nikon D200 (Adobe Camera Raw 3) |
10.6 | 9.65 | 8.96 | 7.61 |
| Canon 7D (Camera JPEG) (ALO STD by default) |
-- | 9.70 | 8.54 | 7.54 |
| Nikon D80 (Adobe Camera Raw 3.6) |
11.1 | 10.4 | 9.42 | 7.51 |
| 7.5 Stops | ||||
| Nikon D300S (Camera JPEG) |
-- | -- | -- | 7.49 |
| Olympus E-500 (Adobe Camera Raw 3) |
10.7 | 9.97 | 8.90 | 7.46 |
| Olympus E-510 (Adobe Camera Raw 4.1) |
10.0 | 9.43 | 8.64 | 7.46 |
| Pentax K10D (Camera JPEG) |
-- | 9.49 | 8.88 | 7.44 |
| Nikon D300 (Camera JPEG) |
-- | -- | 8.70 | 7.44 |
| Olympus E-420 (Adobe Camera Raw 4.1.1) |
10.0 | 9.61 | 8.65 | 7.44 |
| Canon Rebel T1i (Camera JPEG) (ALO=STD by default) |
11.3 | 10.1 | 9.34 | 7.43 |
| Nikon D2Xs (Adobe Camera Raw 3.6) |
10.6 | 9.90 | 8.93 | 7.42 |
| Canon EOS 40D (Camera JPEG) |
10.6 | 9.52 | 8.78 | 7.42 |
| Nikon D3X (Camera JPEG) |
-- | -- | -- | 7.37 |
| Nikon D50 (Camera JPEG) |
10.7 | 9.93 | 8.70 | 7.36 |
| Sony A380 (Camera JPEG) (DRO Standard by default) |
-- | 9.54 | 8.84 | 7.32 |
| Panasonic DMC-G1 (Adobe Camera Raw 5.2) |
10.7 | 9.78 | 8.70 | 7.32 |
| Nikon D3000 (Camera JPEG) |
10.2 | 9.64 | 8.69 | 7.31 |
| Sony A900 (Camera JPEG) (DRO off by default ) |
10.2 | 9.75 | 8.49 | 7.31 |
| Sony A330 (Camera JPEG) (DRO Standardby default) |
10.1 | 9.37 | 8.59 | 7.30 |
| Sony A200 (Camera JPEG) (DRO on by default) |
10.4 | 9.43 | 8.91 | 7.29 |
| Canon EOS 20D (Camera JPEG) |
10.3 | 9.66 | 8.85 | 7.29 |
| Canon EOS 30D (Camera JPEG) |
10.3 | 9.50 | 8.57 | 7.29 |
| Nikon D40 (Camera JPEG) |
10.4 | 9.80 | 8.89 | 7.28 |
| Sony A230 (Camera JPEG) (DRO Standard by default) |
10.1 | 9.51 | 8.51 | 7.26 |
| Sony A900 (Camera JPEG) (DRO on) |
10.1 | 9.76 | 8.47 | 7.26 |
| Canon Rebel XS (Camera JPEG) |
10.3 | 9.4 | 8.61 | 7.22 |
| Olympus E-520 (Adobe Camera Raw 4.5) |
11.0 | 9.46 | 8.70 | 7.20 |
| Sony A350 (Camera JPEG) (DRO on by default) |
10.3 | 9.55 | 8.85 | 7.19 |
| Pentax K-x Camera JPEG |
9.99 | 8.94 | 8.31 | 7.18 |
| Panasonic DMC-GF1 (Adobe Camera Raw 5.5) |
10.2 | 9.62 | 8.62 | 7.16 |
| Nikon D80 (Camera JPEG) |
10.1 | 9.43 | 8.48 | 7.12 |
| Canon Digital Rebel XT (Camera JPEG) |
10.3 | 9.51 | 8.61 | 7.11 |
| Nikon D200 (Camera JPEG) |
-- | 9.07 | 8.36 | 7.11 |
| Olympus E-300 (Camera JPEG) |
10.8 | 9.26 | 8.48 | 7.07 |
| Olympus E-410 (Adobe Camera Raw 4.1) |
10.2 | 9.40 | 8.24 | 7.05 |
| Olympus E-500 (Camera JPEG) |
10.0 | 9.14 | 8.16 | 7.05 |
| Canon Digital Rebel XTi (Camera JPEG) |
9.83 | 9.10 | 8.27 | 7.04 |
| Canon EOS-1Ds Mark II (Camera JPEG) |
10.3 | 9.38 | 8.60 | 7.04 |
| Panasonic DMC-G1 (Camera JPEG) |
-- | 9.33 | 8.52 | 7.03 |
| Pentax K200D (Camera JPEG) |
-- | 9.50 | 8.30 | 7.01 |
| 7.0 Stops | ||||
| Panasonic DMC-GF1 (Camera JPEG) |
-- | 9.33 | 8.44 | 6.99 |
| Canon Digital Rebel (Camera JPEG) |
10.1 | 9.11 | 8.47 | 6.97 |
| Nikon D2Xs (Camera JPEG) |
9.82 | 8.98 | 8.23 | 6.97 |
| Panasonic DMC-L10 (Adobe Camera Raw 4.2) |
10.4 | 9.34 | 8.48 | 6.91 |
| Sigma DP1 (Camera JPEG) |
-- | 8.95 | 8.13 | 6.91 |
| Pentax *istDs (Camera JPEG) |
10.2 | 10.0 | 8.87 | 6.90 |
| Sony A100 (Camera JPEG) |
10.2 | 9.24 | 8.39 | 6.89 |
| Samsung NX10 (Camera JPEG, Smart Range, ISO 200) |
10.1 | 8.99 | 8.22 | 6.78 |
| Pentax K100D (Camera JPEG) |
10.3 | 9.30 | 8.39 | 6.73 |
| Pentax K20D (Camera JPEG) |
10.2 | 9.21 | 8.09 | 6.66 |
| Pentax K-7 (Camera JPEG) |
9.59 | 8.87 | 8.03 | 6.54 |
| 6.5 Stops | ||||
| Nikon D2x (Camera JPEG) |
-- | 8.93 | 7.75 | 6.43 |
| Olympus E-3 (Camera JPEG) |
9.32 | 9.06 | 8.50 | 6.42 |
| Panasonic DMC-L10 (Camera JPEG) |
-- | 8.94 | 8.00 | 6.38 |
| Olympus E-420 (Camera JPEG) |
9.18 | 8.82 | 7.93 | 6.37 |
| 6.0 Stops | ||||
| Olympus E-410 (Camera JPEG) |
-- | -- | 7.60 | 5.99 |
| Samsung NX10 (Camera JPEG) |
9.32 | 8.48 | 7.46 | 5.88 |
| Nikon D70s (Camera JPEG) |
9.84 | 8.69 | 7.46 | 5.85 |
| Nikon D70 (Camera JPEG) |
9.81 | 8.76 | 7.58 | 5.84 |
| Olympus E-520 (Camera JPEG) |
9.32 | 8.68 | 7.74 | 5.74 |
| Olympus E-P2 (Camera JPEG, Gradation = Normal) |
10.1 | 8.83 | 7.78 | 5.58 |
| Olympus E-P1 (Camera JPEG, Gradation = Normal) |
-- | 8.85 | 7.74 | 5.47 |
Note that this test is repeatable to within 1/3 EV according to the Imatest website, so differences of less than 0.33 can be ignored.
When it comes to the Samsung NX10, as noted above, its low scores for camera JPEGs reflect Samsung's decision to leave more image noise in its files, so as to not have to trade away as much subject detail. We're finding that we prefer this approach to cameras that smudge away subtle subject detail just to achieve lower noise levels in areas of flat tint. On the other hand, the improvement when Smart Range was enabled is partially due to the increased noise reduction in the shadows, something we'd rather not see. We encourage readers to look at our actual test images (particularly the OUTB and FAR shots, which really challenge a camera's dynamic range), rather than making their decision solely on the basis of the numbers in the chart above.
Samsung NX10 Resolution Chart Test Results
The chart above shows consolidated results from spatial frequency response measurements in both the horizontal and vertical axes. The "MTF 50" numbers tend to correlate best with visual perceptions of sharpness, so those are what we focus on here. The uncorrected resolution figures are 2,328 line widths per picture height in the horizontal direction (corresponding to the vertically-oriented edge), and 2,298 lines along the vertical axis (corresponding to the horizontally-oriented edge), for a combined average of 2,313 LW/PH.. Correcting to a "standardized" sharpening with a one-pixel radius reduced the resolution score by quite a bit, resulting in a lower average of 1,693 LW/PH, which is surprisingly low for a 14-megapixel sensors. Imatest clearly had difficulty "undoing" the default sharpening applied to arrive at a valid standardized number. See explanation for this at the bottom of this page.
To see what's going on, refer to the plots below, which show the actual edge profiles for both horizontal and vertical edges, in both their original and corrected forms. Here, you can see that a very high amount of in-camera sharpening is applied in the horizontal direction (oversharpened by only 18.1 %), as well as in the vertical direction (18.2 % oversharpened), explaining why standardized sharpening reduced the the MTF 50 numbers by so much.
Note: We don't feature SFR-based LW/PH resolution numbers more prominently in our reviews (eg, outside the Imatest pages) because we've found that they're *very* sensitive to minor differences in in-camera image processing. Relatively small changes in the amount of in-camera sharpening can have a large effect on the resulting resolution numbers. Imatest attempts to compensate for this by adjusting to a "standard" sharpening, but this approach can't completely undo what happens inside the cameras, and so often gives inconsistent results. Sometimes the "standardized" sharpening happens to just match the shape of the edge profile with the in-camera sharpening applied, and you'll get wildly high results. At other times, it will tend to correct in the opposite direction. Unfortunately, ignoring the in-camera sharpening entirely can result in even greater discrepancies, particularly between models from different manufacturers. Turning off sharpening in the camera may or may not fully eliminate the sharpening, so simply turning off sharpening in the camera JPEGs isn't a reliable solution. It also wouldn't be the way most people shoot the cameras. We could process RAW files with no sharpening (as shown below), but then that'd only suit the people working primarily or exclusively from RAW, and would open another can of worms as to what RAW converter was used, etc, etc.
The bottom line is that numbers for resolution only take you so far. Detail handling and edge acuity are very complex issues; ones that don't easily boil down to a single number. The best approach is to simply look look at the broad array of standardized test shots we take with each camera, to the point of downloading and printing them with whatever processing you'd use if you owned the camera and shot with it. See how the differences stack up for you visually, and make your decision on that, rather than on abstract resolution numbers.
Since the standardized results for the camera JPEGs were so poor because of the high default in-camera sharpening, we went ahead and analyzed a dcraw converted RAW file that had no sharpening applied. As expected, we were able to get a much higher standardized numbers of 2,670 LW/PH in both directions:
As always, careful processing of RAW files in a good third-party RAW conversion program will yield a good bit more fine detail than can be seen in the in-camera JPEGs, regardless of in-camera sharpening.
 Fujifilm GFX 50S Review
 Fujifilm X-T3 Review
 Olympus E-M5 III Review

Follow Imaging Resource