Canon EOS 40D Imatest Results
We routinely use Norman Koren's excellent "Imatest" analysis program for quantitative, thoroughly objective analysis of digicam test images. I highly recommend it to our technically-oriented readers, as it's far and away the best, most comprehensive analysis program I've found to date.
My comments below are just brief observations of what we see in the Imatest results. A full discussion of all the data Imatest produces is really beyond the scope of this review: Visit the Imatest web site for a full discussion of what the program measures, how it performs its computations, and how to interpret its output.
Here's some of the results produced by Imatest for the Canon EOS 40D:
(Note that we've updated the color and noise analysis since the review, as we originally had slightly higher exposure error (0.31EV) than what is recommended (<=0.25EV) by Imatest.)
Canon 40D Color Accuracy
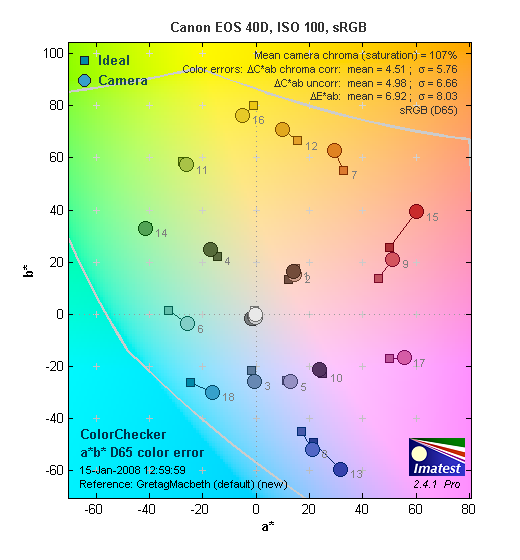
Using the Standard Picture Style, the Canon EOS 40D showed good color accuracy, though slightly higher saturation levels than we're accustomed to finding in semi-pro SLRs. Hue accuracy was very good to excellent, with most of the hue shift occurring in the cyans, sky blues, and oranges. Average saturation was 107% (oversaturated by 7%, mostly in the reds, a bit in some blues, greens and oranges). Average "delta-C" color error was only 4.51 after correction for saturation, making the 40D one of the most hue-accurate cameras we've tested. (Delta-C is the same as the more commonly referred to delta-E, but delta-C takes into account only color differences, ignoring luminance variation.) All in all, a very good color response for an SLR.
Adobe RGB Accuracy Comparison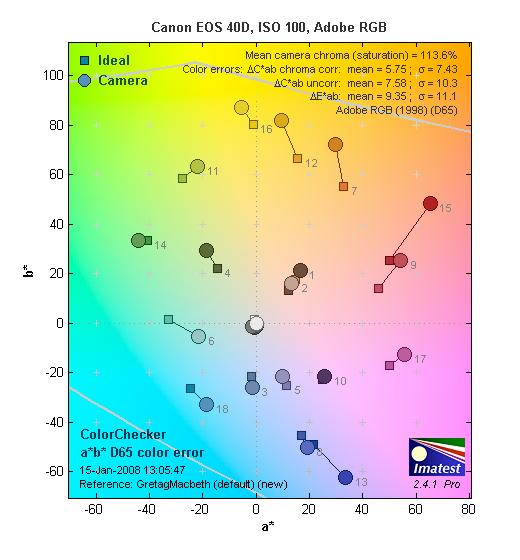 |
|||
Using the Adobe RGB color space (which provides a much wider gamut, or range of colors that can be expressed), the Canon EOS 40D delivers more highly saturated color, with an average hue error of 5.75 "delta-C" units, and average saturation of 113.6%. If you mouse over the links below the illustration above, you can compare the 40D's Adobe RGB response with that of three other cameras, the Canon EOS-5D, the Nikon D80, and the Nikon D200.
Color Analysis
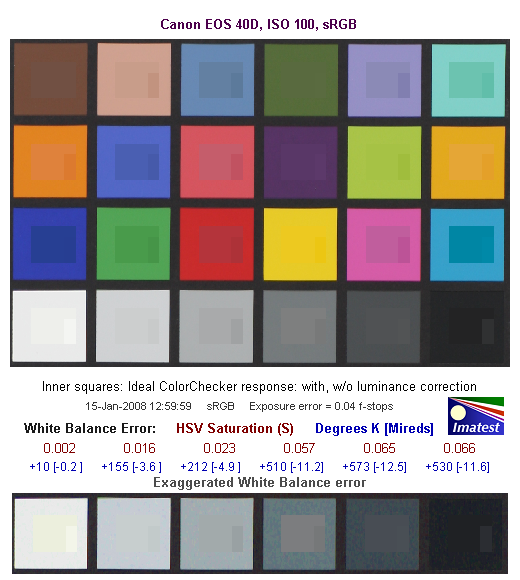
This image shows how the Canon EOS 40D actually rendered the colors of the MacBeth chart, compared to a numerically ideal treatment. In each color swatch, the outer perimeter shows the color as actually captured by the camera, the inner square shows the numerically ideal color, after correcting for the luminance of the photographed chart (as determined by a second-order curve fit to the values of the gray swatches), and the small rectangle inside the inner square shows the numerically ideal color, without any luminance correction. This image shows the excellent hue accuracy, as well as a contrast curve that results in moderate overexposure of some of the highest-saturation swatches.
Gray Patch Tone and Noise Analysis
There's a lot in this particular graph, a lot more than we have room to go into here. (This set of plots has also changed a little in the more recent versions of Imatest. Some of the plots that were shown here previously are now shown in other Imatest output. Since we largely focus on the Noise Spectrum plot, we'll only show the graphic above, which includes that plot.) Bottom line, the Canon EOS 40D's noise levels are low at low ISO, with a frequency spectrum that has more energy on the higher frequency (right-hand) side of the curve than do many cameras. What's very odd here though, is how much more noise energy the red channel has at low frequencies, seen in the large spike on the left-hand side of the curve. This might be an issue, but the overall noise levels are so low that the noise spike in the red channel isn't really visible at ISO 100.
In comparing these graphs with those from competing cameras, I've found that the Noise Spectrum graph at lower right is the most important. Cameras that manage to shift their noise spectrum to higher frequencies have much finer-grained noise structures, making their noise less visually objectionable. In the graph above, this would show up as a noise spectrum curve that remained higher on the right side, representing higher noise frequencies. The champion at this was the Canon EOS-1Ds Mark II, which produced remarkably fine-grained image noise, even at very high ISOs. The 40D's noise performance doesn't nearly rise to the level of the 1Ds Mark II, but it nonetheless does a good job of keeping plenty of the noise energy at high frequencies, what little low-ISO image noise that's there is more fine-grained as a result.
Here's the same set of noise data at ISO 3,200. Here, the Noise Spectrum graph still shows excellent high-frequency content, evidenced by the gentle slope of the noise curve. Absolute noise levels still better than those of many competing cameras, and the excellent shaping of the noise characteristic results in a very pleasant fine/tight "grain" structure. Personal tastes invariably differ quite a bit, but we find the Canon 40D's high-ISO noise to be quite pleasing: ISO 3200 images are still relatively sharp overall, the noise pattern is very fine-grained, and quite a lot of finer subject detail is left in the images. (Note though, that a good RAW converter and associated third-party noise reduction filtering software can deliver considerably better results than the camera's own processor does in making the in-camera JPEGs.)
This chart compares the Canon EOS 40D's noise performance over a range of ISOs against that of other cameras. While I continue to show noise plots of this sort because readers ask for them, I each time point out that the noise magnitude is only a small part of the story, the grain pattern being much more important. In the case of the Canon EOS 40D, the magnitude of the image noise is quite low at ISO 100, but increased somewhat at higher ISO settings, with a noticeable "bump" at ISO 800. As noted above though, the 40D's noise is very fine-grained, and so not nearly as objectionable as that from some cameras with similar or lower levels but a more blotchy appearance. A job well done.
Canon 40D Dynamic Range Analysis
A key parameter in a digital camera is its Dynamic Range, the range of brightness that can be faithfully recorded. At the upper end of the tonal scale, dynamic range is dictated by the point at which the RGB data "saturates" at values of 255, 255, 255. At the lower end of the tonal scale, dynamic range is determined by the point at which there ceases to be any useful difference between adjacent tonal steps. Note the use of the qualifier "useful" in there: While it's tempting to evaluate dynamic range as the maximum number of tonal steps that can be discerned at all, that measure of dynamic range has very little relevance to real-world photography. What we care about as photographers is how much detail we can pull out of the shadows before image noise becomes too objectionable. This, of course, is a very subjective matter, and will vary with the application and even the subject matter in question. (Noise will be much more visible in subjects with large areas of flat tints and subtle shading than it would in subjects with strong, highly contrasting surface texture.)
What makes most sense then, is to specify useful dynamic range in terms of the point at which image noise reaches some agreed-upon threshold. To this end, Imatest computes a number of different dynamic range measurements, based on a variety of image noise thresholds. The noise thresholds are specified in terms of f-stops of equivalent luminance variation in the final image file, and dynamic range is computed for noise thresholds of 1.0 (low image quality), 0.5 (medium image quality), 0.25 (medium-high image quality) and 0.1 (high image quality). For most photographers and most applications, the noise thresholds of 0.5 and 0.25 f-stops are probably the most relevant to the production of acceptable-quality finished images, but many noise-sensitive shooters will insist on the 0.1 f-stop limit for their most critical work.
The image below shows the test results from Imatest for an in-camera JPEG file from the Canon EOS 40D with a nominally-exposed density step target (Stouffer 4110), and the 40D's contrast setting at its default position.
These are decent numbers for a current-model DSLR, in the mid- to upper range of cameras we've tested. The tone curve also has a nice "S" shape to it, providing good gradation in both highlights and shadows. This can be seen when closely inspecting shots captured by the 40D, where detail is held nicely in both strong highlights and deep shadows.
Processing the 40D's RAW (CR2) files through Adobe Camera Raw (ACR) version 4.2 improved dynamic range by 1/3 to 1/2 stop. Results were similar with both ACR's automatic settings and when fiddling with the sliders manually. (Manual results were about 0.1 stop better at the highest quality threshold, but 0.05 - 0.1 stop worse at the lower quality thresholds.) Worth noting here is that ACR's default noise reduction settings reduced the red-channel noise relative to the levels in the in-camera JPEG, but at the cost of somewhat higher noise in the blue and green channels, and slightly higher luminance noise overall. ACR also shifted even more of the noise energy into high spatial frequencies, making its residual noise even less objectionable than that found in the camera JPEGs.
Canon 40D Highlight Tone Priority
Like the EOS-1D Mark III announced a few months earlier, the Canon 40D offers an exposure setting called "Highlight Tone Priority" or HTP for short. The intent of HTP is to preserve highlights, but as we've seen in the test images and will see in the graphs below, it does so at the cost of somewhat higher shadow noise.
HTP is only available at ISO settings of 200 and above, which suggests some of how it works. At ISO 200 and normal exposure, the charge "buckets" in the sensor pixels only get about half full. This gives almost a full stop of exposure latitude before hot highlights start to saturate the sensor wells. Taking advantage of its 14-bit A/D conversion, Canon's HTP exposure mode imposes a different tone curve; one that's very flat at the highlight end. This compresses the highlight information (in much the same way color negative film does), yet maintains relatively normal contrast through the midtones and into the shadows. The cost is a more abrupt transition from deep shadows to black, and greater image noise in the shadow areas.
The density response graph above perfectly illustrates what HTP is doing. Notice how smooth and flat the top end of the tone curve is, compressing the tonal response in the highlights, translating large steps in subject brightness to small changes in luminance in the file. This is exactly what Canon claims it does, and the results are quite visible in subjects containing strong, non-specular highlights. The cost though, is higher image noise, seen in the Noise graph at the bottom left of the illustration, with noise levels in HTP mode being almost twice those in normal exposure mode. (To be expected, since the camera is operating at ISO 200.) The total dynamic range (irrespective of image noise) is about 0.8 stops greater in HTP mode, but the useful dynamic range (limited by noise performance) is essentially identical. (Again, no surprise, as the usable dynamic range is limited by the noise levels of the sensor, amplifiers, and A/D electronics. Playing games with the exposure and tone curve does nothing to alter the fundamental characteristics of the sensor and interface electronics. - But they can let you choose where and how to spend your available dynamic range, to achieve more useful results in your final images.
As was the case with the normally exposed test images from the 40D, processing the 40D's HTP-mode RAW (CR2) files through Adobe Camera Raw (ACR) version 4.2 improved dynamic range by 1/3 to 1/2 stop. Per the discussion above, you really wouldn't expect to see any change here, since the dynamic range of the sensor and electronics is still the same.
Dynamic Range, the bottom line:
The net result was that the 40D performed quite competitively with current DSLR models, its in-camera JPEGs bested only by those from the Fujifilm S3 Pro, the Nikon D40x, and the Canon EOS-5D (at least among the cameras we've tested to date).
To get some perspective, here's a summary of the Canon EOS 40D's dynamic range performance, and how it compares to other digital SLRs that we also have Imatest dynamic range data for. (Results are arranged in order of decreasing dynamic range at the "High" quality level.):
| Dynamic Range (in f-stops) vs Image Quality (At camera's minimum ISO) |
||||
| Model | 1.0 (Low) |
0.5 (Medium) |
0.25 (Med-High) |
0.1 (High) |
| Fujifilm S3 Pro (Adobe Camera Raw 2) |
12.1 | 11.7 | 10.7 | 9.0 |
| Nikon D40x (Adobe Camera Raw 4.1) |
12.0 | 10.9 | 10.3 | 8.9 |
| Nikon D40 (Adobe Camera Raw 4.1) |
11.9 | 10.9 | 9.89 | 8.3 |
| Pentax K-100D (Adobe Camera Raw 3.6) |
11.3 | 10.3 | 9.51 | 8.23 |
| Pentax K10D (Adobe Camera Raw 3.7) |
10.6 | 10.0 | 9.29 | 8.19 |
| Canon EOS-1Ds Mark II (Adobe Camera Raw 3) |
11.2 | 10.3 | 9.4 | 8.14 |
| Nikon D40x | 10.8 | 10.0 | 9.42 | 8.04 |
| Fujifilm S3 Pro | -- | 9.9 | 9.4 | 7.94 |
| Canon Digital Rebel XTi (Adobe Camera Raw 3.6) |
10.8 | 9.88 | 9.18 | 7.84 |
| Canon EOS-5D (Adobe Camera Raw 3) |
11.0 | 10.4 | 9.21 | 7.83 |
| Canon EOS-40D (Adobe Camera Raw 4.2) |
11.2 | 10.1 | 9.26 | 7.72 |
| Canon EOS-5D (Camera JPEG) |
10.2 | 9.68 | 8.82 | 7.65 |
| Nikon D200 (Adobe Camera Raw 3) |
10.6 | 9.65 | 8.96 | 7.61 |
| Nikon D80 (Adobe Camera Raw 3.6) |
11.1 | 10.4 | 9.42 | 7.51 |
| Olympus E510 (Adobe Camera Raw 4.1) |
10.0 | 9.43 | 8.64 | 7.46 |
| Pentax K10D | -- | 9.49 | 8.88 | 7.44 |
| Canon EOS-40D (Camera JPEG) |
10.6 | 9.52 | 8.78 | 7.42 |
| Nikon D50 | 10.7 | 9.93 | 8.70 | 7.36 |
| Canon EOS 20D | 10.3 | 9.66 | 8.85 | 7.29 |
| Nikon D40 | 10.4 | 9.8 | 8.89 | 7.28 |
| Nikon D80 (Camera JPEG) |
10.1 | 9.43 | 8.48 | 7.12 |
| Canon Digital Rebel XT | 10.3 | 9.51 | 8.61 | 7.11 |
| Nikon D200 (Camera JPEG) |
-- | 9.07 | 8.36 | 7.11 |
| Olympus EVOLT | 10.8 | 9.26 | 8.48 | 7.07 |
| Olympus E410 (Adobe Camera Raw 4.1) |
10.2 | 9.4 | 8.24 | 7.05 |
| Canon Digital Rebel XTi (Camera JPEG) |
9.83 | 9.10 | 8.27 | 7.04 |
| Canon EOS-1Ds Mark II (Camera JPEG) |
10.3 | 9.38 | 8.6 | 7.04 |
| Canon Digital Rebel | 10.1 | 9.11 | 8.47 | 6.97 |
| Pentax *istDs | 10.2 | 10 | 8.87 | 6.9 |
| Pentax K-100D (Camera JPEG) |
10.3 | 9.3 | 8.39 | 6.73 |
| Nikon D2x | -- | 8.93 | 7.75 | 6.43 |
| Olympus E410 | -- | -- | 7.60 | 5.99 |
| Nikon D70s | 9.84 | 8.69 | 7.46 | 5.85 |
| Nikon D70 | 9.81 | 8.76 | 7.58 | 5.84 |
| Olympus E510 | 7.70 | 7.16 | 5.87 | 3.55 |
The results shown in the table are interesting. One of the first things that struck me when I initially looked at test data for a wide range of d-SLRs, was that here again, purely analytical measurements don't necessarily correlate all that well with actual photographic experience. There's no question that the Fuji S3 Pro deserves its place atop the list, as its unique "SR" technology does indeed deliver a very obvious improvement in tonal range in the highlight portion of the tonal scale. I was surprised to see the analytical results place the Olympus EVOLT as highly as they did, given that our sense of that camera's images was that they were in fact noisier than those of many other d-SLRs that we looked at. In the other direction, I was quite surprised to see the Nikon D2x place as low on the listings as it did, given that we found that camera's shadow detail to be little short of amazing.
One thing that's going on here though, is that we tested each camera at its lowest ISO setting, which should produce best-case noise levels. This is in fact what many photographers will be most interested in, but it does perhaps place some of the Nikons (like the D40) at a disadvantage, as their lowest ISO setting is 200, as compared to the ISO 100 settings available on most other models.
Regardless of the positions of the other cameras though, the Canon EOS 40D does appear to offer pretty good dynamic range, ranking among the best cameras we've tested to date. It does an excellent job of preserving highlight detail, even in its normal (non-HTP) exposure mode, and likewise holds good detail far into the shadows. Where noise does appear in the deepest shadows, it has a relatively tight grain pattern, making it less objectionable than that of many other cameras on the market.
As I always say though, at the end of the day I think you have to take the figures here with a grain of salt, and look at actual images with your own eyes to see what you make of each camera's tonal range and noise levels. We'll continue performing these dynamic range tests on the digital SLRs that we review, but (just as with the laboratory resolution target results), we suggest that you not rely on them exclusively for making your purchase decisions.
Canon 40D Resolution Chart Test Results
The chart above shows consolidated results from spatial frequency response measurements in both the horizontal and vertical axes. The "MTF 50" numbers tend to correlate best with visual perceptions of sharpness, so those are what I focus on here. The uncorrected resolution figures are 1,481 line widths per picture height in the horizontal direction (corresponding to the vertically-oriented edge), and 1,615 lines along the vertical axis (corresponding to the horizontally-oriented edge). Correcting to a "standardized" sharpening with a one-pixel radius increased both vertical and horizontal resolution significantly, resulting in an average of 1,680 LW/PH, somewhat below the best we've seen for a 10-megapixel camera, perhaps reflecting the slightly more aggressive anti-aliasing filtering found in many Canon SLRs.
To see what's going on, refer to the plots below, which show the actual edge profiles for both horizontal and vertical edges, in both their original and corrected forms. Here, you can see that there is in fact a little in-camera sharpening applied (the noticeable bump at the top ends of the black curves), that the standard sharpening operator only corrects for somewhat. While we didn't run the graphs to prove it, you'd likely do well to run the 40D with slightly lower than normal in-camera sharpening and the use strong/tight sharpening post-exposure in Photoshop or some other image editor.
 Fujifilm GFX 50S Review
 Fujifilm X-T3 Review
 Olympus E-M5 III Review

Follow Imaging Resource