Pentax K10D Imatest Results
We routinely Norman Koren's excellent "Imatest" analysis program for quantitative, thoroughly objective analysis of digicam test images. I highly commend it to our technically-oriented readers, as it's far and away the best, most comprehensive analysis program I've found to date.
My comments below are just brief observations of what we see in the Imatest results. A full discussion of all the data Imatest produces is really beyond the scope of this review: Visit the Imatest web site for a full discussion of what the program measures, how it performs its computations, and how to interpret its output.
Here are some of the results produced by Imatest for the Pentax K10D:
Color Accuracy
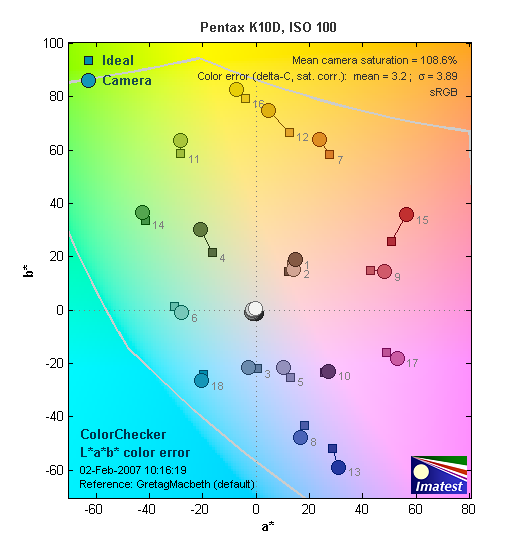
The Pentax K10D showed really excellent color accuracy overall, holding strong reds more in check than almost any other camera we've encountered. Its greatest color error was a hue shift of medium-orange toward yellow, but even that was relatively slight. Average saturation was 108.6% (oversaturated by 8.6%, largely in the reds, but somewhat in the blues as well); average "delta-E" color error was 302 after correction for saturation, the most accurate color rendition we've ever tested, if memory serves me. All in all, unusually accurate color, among the best we've seen. (Some consumers may find its strictly accurate rendering less vibrant than that of some other cameras, but pros should welcome this level of accuracy in their work.)
Color Analysis
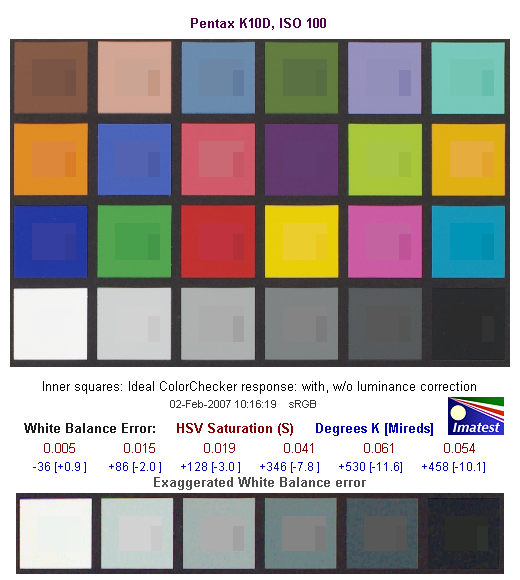
This image shows how the Pentax K10D actually rendered the colors of the MacBeth chart, compared to a numerically ideal treatment. (Apologies for the tilt, the MacBeth chart on our Multi target has slipped slightly.) In each color swatch, the outer perimeter shows the color as actually captured by the camera, the inner square shows the color after correcting for the luminance of the photographed chart (as determined by a 2nd-order curve fit to the values of the gray swatches), and the small rectangle inside the inner square shows what the color should actually be, based on perfect rendering in the sRGB color space. This image shows the excellent hue accuracy, as well as a gamma curve that tends to concentrate more of its tonal range in the upper end of the tone curve, rather than the shadows. (Note how most of the tone-corrected swatches are a fair bit lighter than the true values.)
Gray Patch Tone and Noise Analysis
As always, there's a lot in this particular graph, a lot more than we have room to go into here. Bottom line, the Pentax K10D's noise levels are quite low at low ISO, and the frequency spectrum favors higher frequencies a bit more than do those of many cameras. In comparing these graphs with those from other competing cameras, I've found that the Noise Spectrum graph at lower right is the most important. Cameras that manage to shift their noise spectrum to higher frequencies have much finer-grained noise structures, making their noise less visually objectionable. In the graph above, this would show up as a noise spectrum curve that remained higher on the right side, representing higher noise frequencies. The champion at this was the Canon EOS-1Ds Mark II, which produced remarkably fine-grained image noise, even at very high ISOs. The K10D's noise spectrum doesn't rise to that standard, but is pretty good for a camera in its price bracket.
Here's the same set of noise data at ISO 1600. Here, the Noise Spectrum graph is shifted more toward the left-hand, lower-frequency side than it was at ISO 100, and the high-frequency side is much lower; coarsening the "grain" of the image noise patterns.
This chart compares the Pentax K10D's noise performance over a range of ISOs against that of other cameras. While I continue to show noise plots of this sort because readers ask for them, I each time point out that the noise magnitude is only a small part of the story, the grain pattern being much more important. There's also the matter of how much subtle subject detail is traded away in pursuit of low noise figures. In the case of the Pentax K10D, it's pretty much in the middle of the pack across much of its ISO range, rising to higher values at its ISO 1,600 maximum.
Dynamic Range Analysis
A key parameter in a digital camera is its Dynamic Range, the range of brightness that can be faithfully recorded. At the upper end of the tonal scale, dynamic range is dictated by the point at which the RGB data "saturates" at values of 255, 255, 255. At the lower end of the tonal scale, dynamic range is determined by the point at which there ceases to be any useful difference between adjacent tonal steps. Note the use of the qualifier "useful" in there: While it's tempting to evaluate dynamic range as the maximum number of tonal steps that can be discerned at all, that measure of dynamic range has very little relevance to real-world photography. What we care about as photographers is how much detail we can pull out of the shadows before image noise becomes too objectionable. This, of course, is a very subjective matter, and will vary with the application and even the subject matter in question. (Noise will be much more visible in subjects with large areas of flat tints and subtle shading than it would in subjects with strong, highly contrasting surface texture.)
What makes most sense then, is to specify useful dynamic range in terms of the point at which image noise reaches some agreed-upon threshold. To this end, Imatest computes a number of different dynamic range measurements, based on a variety of image noise thresholds. The noise thresholds are specified in terms of f-stops of equivalent luminance variation in the final image file, and dynamic range is computed for noise thresholds of 1.0 (low image quality), 0.5 (medium image quality), 0.25 (medium-high image quality) and 0.1 (high image quality). For most photographers and most applications, the noise thresholds of 0.5 and 0.25 f-stops are probably the most relevant to the production of acceptable-quality finished images, but many noise-sensitive shooters will insist on the 0.1 f-stop limit for their most critical work.
The image below shows the test results from Imatest for an in-camera JPEG file from the Pentax K10D with a nominally-exposed density step target (Stouffer 4110), with the K10D's contrast setting at its default position.
This is a bit of a puzzling result, in that, while the numbers look very good, the tone curve is rather odd, to say the least. The K10D seems to concentrate most of its tonal resolution in the upper half of the tone curve (from midtones through highlights). This should give smoother tonal gradations in the quarter-tones and highlights, but at the cost of lost detail in the darkest shadows. This is in fact what we found with the K10D in our studio tests, although we didn't feel that highlight rendition was actually superior to that of other competing models, while the deepest shadows were indeed very plugged up and posterized. That said though, it begs the question of whether anyone would care about detail as deep into the shadows as where we found the posterization happening. (For comparison with a more typical tone curve, check out the Nikon D80 Imatest page.)
Tone-curve strangeness aside, the dynamic range number for the K10D at the highest quality level (allowing only 0.1 EV of noise) is close to the very best that we've seen, only a third of an EV down from the Canon EOS-5D, and a half an EV down from the Fuji FinePix S3 Pro. At lower quality thresholds though (e.g., 0.25 or 0.5 EV of noise permitted), the dynamic range falls below that of many competing models.
That's the story with JPEG files created in the camera, how about in an external RAW converter, such as Adobe Camera Raw (ACR)?
Using its automatic settings (which in my experience have generally worked best for dynamic range tests like this), ACR managed to extract a solid three-quarters of a stop more dynamic range from the DNG file at the highest quality level, producing a more linear tone curve in the process.
While I've generally used ACR's auto settings in the past, I found with the K10D that some manual tweaking with the exposure and contrast settings ended up extracting a good bit more dynamic range at lower quality levels, although slightly less at the most restrictive noise threshold.
Dynamic Range, the bottom line:
So what can we conclude about the K10D's dynamic range? I think two things: First, that its internal JPEG output produces a unusually-shaped tone curve, apparently trying for smoother gradation in the midtones to highlights, at the expense of the deepest shadows. Second, the K10D's DNG RAW files do contain a modest amount of additional information that the right RAW converter can extract.
To get some perspective, here's a summary of the Pentax K10D's dynamic range performance, and how it compares to other digital SLRs that we also have Imatest dynamic range data for. (Results are arranged in order of decreasing dynamic range at the "High" quality level.):
| Dynamic Range (in f-stops) vs Image Quality (At camera's minimum ISO) |
||||
| Model | 1.0 (Low) |
0.5 (Medium) |
0.25 (Med-High) |
0.1 (High) |
| Fujifilm S3 Pro (Adobe Camera Raw 2) |
12.1 | 11.7 | 10.7 | 9.0 |
| Pentax K100D (Adobe Camera Raw 3.6) |
11.3 | 10.3 | 9.51 | 8.23 |
| Pentax K10D (Adobe Camera Raw 3.7) |
10.6 | 10.0 | 9.29 | 8.19 |
| Canon EOS-1Ds Mark II (Adobe Camera Raw 3) |
11.2 | 10.3 | 9.4 | 8.14 |
| Fujifilm S3 Pro | -- | 9.9 | 9.4 | 7.94 |
| Canon Digital Rebel XTi (Adobe Camera Raw 3.6) |
10.8 | 9.88 | 9.18 | 7.84 |
| Canon EOS-5D (Adobe Camera Raw 3) |
11.0 | 10.4 | 9.21 | 7.83 |
| Nikon D40 (Adobe Camera Raw 3.7) |
11.7 | 10.7 | 9.45 | 7.75 |
| Canon EOS-5D (Camera JPEG) |
10.2 | 9.68 | 8.82 | 7.65 |
| Nikon D200 (Adobe Camera Raw 3) |
10.6 | 9.65 | 8.96 | 7.61 |
| Nikon D80 (Adobe Camera Raw 3.6) |
11.1 | 10.4 | 9.42 | 7.51 |
| Pentax K10D | -- | 9.49 | 8.88 | 7.44 |
| Nikon D50 | 10.7 | 9.93 | 8.70 | 7.36 |
| Canon EOS 20D | 10.3 | 9.66 | 8.85 | 7.29 |
| Nikon D40 | 10.4 | 9.8 | 8.89 | 7.28 |
| Nikon D80 (Camera JPEG) |
10.1 | 9.43 | 8.48 | 7.12 |
| Canon Digital Rebel XT | 10.3 | 9.51 | 8.61 | 7.11 |
| Nikon D200 (Camera JPEG) |
-- | 9.07 | 8.36 | 7.11 |
| Olympus EVOLT | 10.8 | 9.26 | 8.48 | 7.07 |
| Canon Digital Rebel XTi (Camera JPEG) |
9.83 | 9.10 | 8.27 | 7.04 |
| Canon EOS-1Ds Mark II (Camera JPEG) |
10.3 | 9.38 | 8.6 | 7.04 |
| Canon Digital Rebel | 10.1 | 9.11 | 8.47 | 6.97 |
| Pentax *istDs | 10.2 | 10 | 8.87 | 6.9 |
| Pentax K100D (Camera JPEG) |
10.3 | 9.3 | 8.39 | 6.73 |
| Nikon D2x | -- | 8.93 | 7.75 | 6.43 |
| Nikon D70s | 9.84 | 8.69 | 7.46 | 5.85 |
| Nikon D70 | 9.81 | 8.76 | 7.58 | 5.84 |
Standard Observations:
The results shown in the table are interesting. One of the first things that struck me when I initially looked at test data for a wide range of d-SLRs, was that here again, purely analytical measurements don't necessarily correlate all that well with actual photographic experience. There's no question that the Fuji S3 Pro deserves its place atop the list, as its unique "SR" technology does indeed deliver a very obvious improvement in tonal range in the highlight portion of the tonal scale. I was surprised to see the analytical results place the Olympus EVOLT as highly as they did, given that our sense of that camera's images was that they were in fact noisier than those of many other d-SLRs that we looked at. In the other direction, I was quite surprised to see the Nikon D2x place as low on the listings as it did, given that we found that camera's shadow detail to be little short of amazing.
One thing that's going on here though, is that we tested each camera at its lowest ISO setting, which should produce best-case noise levels. This is in fact what many photographers will be most interested in, but it does perhaps place some of the Nikons at a disadvantage, as for most of them, the lowest ISO setting is 200, as compared to the ISO 100 settings available on most other models.
K10D Specifics:
Regardless of the positions of the other cameras though, the Pentax K10D appears to have good dynamic range, but a tone curve that's weighted heavily toward the highlights.
As I always say though, at the end of the day, I think you have to take the figures here with a grain of salt, and look at actual images with your own eyes to see what you make of each camera's tonal range and noise levels. We'll continue performing these dynamic range tests on the digital SLRs that we review, but (just as with the laboratory resolution target results), we suggest that you not rely on them exclusively for making your purchase decisions.
The chart above shows consolidated results from spatial frequency response measurements in both the horizontal and vertical axes. The "MTF 50" numbers tend to correlate best with visual perceptions of sharpness, so those are what I focus on here. The uncorrected resolution figures are 1,052 line widths per picture height horizontally and 1,152 lw/ph vertically, for an average of 1,102. Correcting to a "standardized" sharpening with a one-pixel radius increases this number dramatically, to an average of 2,037 LW/PH. This characteristic is similar to what we've seen with the Nikon D80 and D200, both of which showed very low uncorrected numbers and very high corrected ones. Like those cameras, the K10D seems to apply only very conservative sharpening in-camera, successfully avoiding adding any sharpening-related artifacts to the camera's images. This does result in lower-than-normal sharpness in unprocessed JPEGs straight from the camera, but also means that the K10D's images take sharpening in Photoshop or other imaging software very well. The "standard" 1-pixel radius sharpening that Imatest applies does an excellent job of compensating for the edge profile of the K10D, with the result that the edges become very sharp with very little overshoot when it's applied.
To see what's going on, refer to the plots below, which show the actual edge profiles for both horizontal and vertical edges, in both their original and corrected forms. Bottom line, the K10D captures very good detail, as befits its 10.2 megapixel sensor. Images straight from the camera will appear softer than those from many competing models, but there are no sharpening artifacts present, and the images take post-capture sharpening very well.
 Fujifilm GFX 50S Review
 Fujifilm X-T3 Review
 Olympus E-M5 III Review

Follow Imaging Resource