Nikon D80 Imatest Results
We routinely Norman Koren's excellent "Imatest" analysis program for quantitative, thoroughly objective analysis of digicam test images. I highly commend it to our technically-oriented readers, as it's far and away the best, most comprehensive analysis program I've found to date.
My comments below are just brief observations of what we see in the Imatest results. A full discussion of all the data Imatest produces is really beyond the scope of this review: Visit the Imatest web site for a full discussion of what the program measures, how it performs its computations, and how to interpret its output.
Here's some of the results produced by Imatest for the Nikon D80:
Color Accuracy

The Nikon D80 showed good color accuracy overall, but got a bit carried away with strong reds and blues. Both are fairly common response with this target (the MacBeth ColorChecker), and the D80's response is fairly typical for consumer DSLRs, more highly saturated than that of pro models. Hue accuracy is excellent, with minor shifts in a number of colors, rather than large shifts in any one area. The largest shift was in yellow-orange, which moved toward yellow a fair bit. Average saturation was 114.6% (oversaturated by 14.6%, largely in the reds, but somewhat in the blues as well), average "delta-E" color error was 5.6 after correction for saturation. All in all, an excellent, nicely-balanced color response for a consumer SLR, among the best we've seen. (Although the Canon Rebel XTi beats it slightly in hue accuracy, and is a bit less saturated with strong reds and blues.)

Using the Adobe RGB color space (which provides a much wider gamut, or range of colors that can be expressed), the Nikon D80 delivers extremely accurate color, with an average saturation-corrected hue error of only 4.76 delta-E units, one of the most accurate readings we've seen, and average saturation of 104.1%. As it turns out, the oversaturation was almost entirely limited to the forest-green color swatch of the MacBeth chart, with most colors being rendered very closely to their mathematically ideal values. Very impressive!
Color Analysis

This image shows how the Nikon D80 actually rendered the colors of the MacBeth chart, compared to a numerically ideal treatment. (Apologies for the tilt, the MacBeth chart on our Multi target had slipped slightly in these shots.) In each color swatch, the outer perimeter shows the color as actually captured by the camera, the inner square shows the color after correcting for the luminance of the photographed chart (as determined by a 2nd-order curve fit to the values of the gray swatches), and the small rectangle inside the inner square shows what the color should actually be, based on perfect rendering in the sRGB color space. This image shows the excellent hue accuracy, as well as a gamma curve that results in an overexposure of highly saturated swatches.
Gray Patch Tone and Noise Analysis

As always, there's a lot in this particular graph, a lot more than we have room to go into here. Bottom line, the Nikon D80's noise levels are low at low ISO, and the frequency spectrum favors higher frequencies a bit more than did that of the D200. In comparing these graphs with those from other competing cameras, I've found that the Noise Spectrum graph at lower right is the most important. Cameras that manage to shift their noise spectrum to higher frequencies have much finer-grained noise structures, making their noise less visually objectionable. In the graph above, this would show up as a noise spectrum curve that remained higher on the right side, representing higher noise frequencies. The champion at this was the Canon EOS-1Ds Mark II, which produced remarkably fine-grained image noise, even at very high ISOs. The D80's noise spectrum doesn't rise to that standard, but is pretty good for a consumer camera.

Here's the same set of noise data at ISO 1600. Here, the Noise Spectrum graph is shifted a bit more toward the left-hand, lower-frequency side than it was at ISO 100, coarsening the "grain" of the image noise patterns. Once again, not bad, and in this case, the D80 actually has a lot less of its noise energy in the range from 0 to 0.2 cycles/pixel than does the competing Canon XTi. This is visible in its images, where the D80's luminance noise is generally lower than that of the XTi. (There is very interesting and subtle difference in the noise spectra of the two cameras though: The D80's has a spike leading right up to zero frequency, whereas the XTi has a dip there. This shows up in high ISO shots as a slightly "splotchy" look to large, uniform dark areas in the D80's images that isn't shown by the XTi's. (You can see this in the black surround on the MacBeth chart in our Multi Target shots.)

Here's the same set of noise data at ISO 3200. Here, the Noise Spectrum graph has a similar shape to the one for ISO 1600, but the overall magnitude of the noise nearly doubles. A pretty good performance, particularly considering that many consumer SLRs don't even offer an ISO setting of 3200. (The D80's luminance noise at ISO 3200 is close to that of the D70S at ISO 1600.)

This chart compares the Nikon D80's noise performance over a range of ISOs against that of other cameras. While I continue to show noise plots of this sort because readers ask for them, I each time point out that the noise magnitude is only a small part of the story, the grain pattern being much more important. There's also the matter of how much subtle subject detail is traded away in pursuit of low noise figures. In the case of the Nikon D80, while it actually does very well in terms of both noise level and noise grain size, it does trade away some subject detail to achieve those results. (See the discussion and examples on the Imaging page of this review.)
Dynamic Range Analysis
A key parameter in a digital camera is its Dynamic Range, the range of brightness that can be faithfully recorded. At the upper end of the tonal scale, dynamic range is dictated by the point at which the RGB data "saturates" at values of 255, 255, 255. At the lower end of the tonal scale, dynamic range is determined by the point at which there ceases to be any useful difference between adjacent tonal steps. Note the use of the qualifier "useful" in there: While it's tempting to evaluate dynamic range as the maximum number of tonal steps that can be discerned at all, that measure of dynamic range has very little relevance to real-world photography. What we care about as photographers is how much detail we can pull out of the shadows before image noise becomes too objectionable. This, of course, is a very subjective matter, and will vary with the application and even the subject matter in question. (Noise will be much more visible in subjects with large areas of flat tints and subtle shading than it would in subjects with strong, highly contrasting surface texture.)
What makes most sense then, is to specify useful dynamic range in terms of the point at which image noise reaches some agreed-upon threshold. To this end, Imatest computes a number of different dynamic range measurements, based on a variety of image noise thresholds. The noise thresholds are specified in terms of f-stops of equivalent luminance variation in the final image file, and dynamic range is computed for noise thresholds of 1.0 (low image quality), 0.5 (medium image quality), 0.25 (medium-high image quality) and 0.1 (high image quality). For most photographers and most applications, the noise thresholds of 0.5 and 0.25 f-stops are probably the most relevant to the production of acceptable-quality finished images, but many noise-sensitive shooters will insist on the 0.1 f-stop limit for their most critical work.
The image below shows the test results from Imatest for an in-camera JPEG file from the Nikon D80 with a nominally-exposed density step target (Stouffer 4110), with the D80's contrast setting at its default position.

These are decent if not exceptional numbers for an in-camera JPEG, but the dynamic range number at "high" quality itself (7.12) isn't the most important thing to look at here. A dynamic range of 7.12 f-stops at high image quality is within a half a stop of most of the D80's competition, not enough difference to be a significant issue. (Yes, a half a stop more dynamic range would be nice, but that's not the main thing that affects what a photographer will perceive as the D80's dynamic range here.)
More significant than the absolute dynamic range is the shape of the density curve, and how smoothly it transitions from highlight to midtone to shadow. The D80 has a nice, smooth curve, approaching both ends of the range at a gradual slope. This contrasts with the rather abrupt shadow end of the D200's curve, which caused that camera to produce somewhat blocky, quantized shadow detail. The D80 does much better in this respect.
That's the story with JPEG files created in the camera, how about in an external RAW converter, such as Adobe Camera Raw (ACR)?

Using its automatic settings (which in my experience has generally worked best for dynamic range tests like this), ACR managed to extract about four tenths of a stop more dynamic range from the NEF file at the highest quality level, although the resulting tone curve doesn't have quite as nice a shape, with a bit of a bump in it, heading into the shadows.
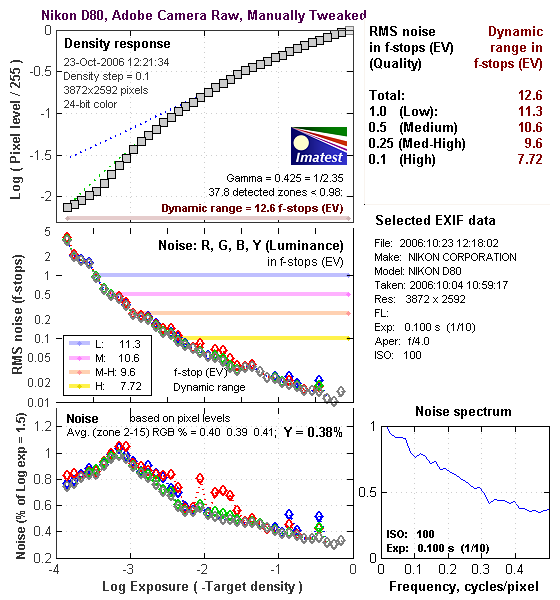
While I've generally used ACR's auto settings in the past, I found with the D80 that manually setting exposure (-1.7 EV), brightness (87), and contrast (minus 35) ended up extracting an additional 0.21 EV of dynamic range. For the sake of consistency with past results though, I'll use the 7.51 EV dynamic range rating for the purposes of comparing to other cameras.
I normally always check the manufacturer's own RAW processing application, but for some reason, couldn't get the latest version (4.4.2) of Nikon's Capture to open the D80's NEF files, and didn't have time to devote to trying to debug the problem. Since we don't use the manufacturer's RAW converter results to make cross-camera comparisons, the behavior of Capture with the D80 was moot for this review.)
Dynamic Range, the bottom line:
So what can we conclude about the D80's dynamic range? I think two things: First, that the D80's internal JPEG output produces a nicely shaped tone curve, with good detail available at both ends of the curve. Second, the D80's NEF files do contain a modest amount of additional information that the right RAW converter can extract.
To get some perspective, here's a summary of the Nikon D80's dynamic range performance, and how it compares to other digital SLRs that we also have Imatest dynamic range data for. (Results are arranged in order of decreasing dynamic range at the "High" quality level.):
| Dynamic Range (in f-stops) vs Image Quality (At camera's minimum ISO) |
||||
| Model | 1.0 (Low) |
0.5 (Medium) |
0.25 (Med-High) |
0.1 (High) |
| Fujifilm S3 Pro (Adobe Camera Raw 2) |
12.1 | 11.7 | 10.7 | 9.0 |
| Canon EOS-1Ds Mark II (Adobe Camera Raw 3) |
11.2 | 10.3 | 9.4 | 8.14 |
| Fujifilm S3 Pro | -- | 9.9 | 9.4 | 7.94 |
| Canon EOS-5D (Adobe Camera Raw 3) |
11.0 | 10.4 | 9.21 | 7.83 |
| Canon EOS-5D (Camera JPEG) |
10.2 | 9.68 | 8.82 | 7.65 |
| Nikon D200 (Adobe Camera Raw 3) |
10.6 | 9.65 | 8.96 | 7.61 |
| Nikon D80 (Adobe Camera Raw 3.6) |
11.1 | 10.4 | 9.42 | 7.51 |
| Nikon D50 | 10.7 | 9.93 | 8.70 | 7.36 |
| Canon EOS 20D | 10.3 | 9.66 | 8.85 | 7.29 |
| Nikon D80 (Camera JPEG) |
10.1 | 9.43 | 8.48 | 7.12 |
| Canon Digital Rebel XT | 10.3 | 9.51 | 8.61 | 7.11 |
| Nikon D200 (Camera JPEG) |
-- | 9.07 | 8.36 | 7.11 |
| Olympus EVOLT | 10.8 | 9.26 | 8.48 | 7.07 |
| Canon EOS-1Ds Mark II (Camera JPEG) |
10.3 | 9.38 | 8.6 | 7.04 |
| Canon Digital Rebel | 10.1 | 9.11 | 8.47 | 6.97 |
| Pentax *istDs | 10.2 | 10 | 8.87 | 6.9 |
| Nikon D2x | -- | 8.93 | 7.75 | 6.43 |
| Nikon D70S | 9.84 | 8.69 | 7.46 | 5.85 |
| Nikon D70 | 9.81 | 8.76 | 7.58 | 5.84 |
Standard Observations:
The results shown in the table are interesting. One of the first things that struck me when I initially looked at test data for a wide range of d-SLRs, was that here again, purely analytical measurements don't necessarily correlate all that well with actual photographic experience. There's no question that the Fuji S3 Pro deserves its place atop the list, as its unique "SR" technology does indeed deliver a very obvious improvement in tonal range in the highlight portion of the tonal scale. I was surprised to see the analytical results place the Olympus EVOLT as highly as they did, given that our sense of that camera's images was that they were in fact noisier than those of many other d-SLRs that we looked at. In the other direction, I was quite surprised to see the Nikon D2x place as low on the listings as it did, given that we found that camera's shadow detail to be little short of amazing.
One thing that's going on here though, is that we tested each camera at its lowest ISO setting, which should produce best-case noise levels. This is in fact what many photographers will be most interested in, but it does perhaps place some of the Nikons at a disadvantage, as their lowest ISO setting is 200, as compared to the ISO 100 settings available on most other models.
D80 Specifics:
Regardless of the positions of the other cameras though, the Nikon D80 does appear to have a good dynamic range, coupled with a well-proportioned tone curve. It happily offers a better-looking tone curve in the shadows than the D200 does, making it easier for shooters of average ability to extract useful shadow detail.
As I always say though, at the end of the day, I think you have to take the figures here with a grain of salt, and look at actual images with your own eyes to see what you make of each camera's tonal range and noise levels. We'll continue performing these dynamic range tests on the digital SLRs that we review, but (just as with the laboratory resolution target results), we suggest that you not rely on them exclusively for making your purchase decisions.

The chart above shows consolidated results from spatial frequency response measurements in both the horizontal and vertical axes. The "MTF 50" numbers tend to correlate best with visual perceptions of sharpness, so those are what I focus on here. The uncorrected resolution figures are 1406 line widths per picture height horizontally and 1410 lw/ph vertically. Correcting to a "standardized" sharpening with a one-pixel radius increases this number quite a bit, to an average of 2423 LW/PH. This characteristic is similar to what we saw with the Nikon D200, which showed very low uncorrected numbers and very high corrected ones. The D200 in particular uses very conservative in-camera processing at its default setting, producing very soft-looking edges but more importantly, ones with no overshoot or other sharpening artifacts. This means that images look very soft straight from the camera, but take subsequent sharpening very well. Aimed more at the consumer market, the D80 sharpens its images a good bit more in the camera, but (as we'll see below) still manages to avoid almost sharpening artifacts almost entirely. It appears that the "standard" 1-pixel radius sharpening that Imatest applies almost exactly compensates for the edge profile of the D80, with the result that the edges become very sharp indeed when it's applied.
To see what's going on, refer to the plots below, which show the actual edge profiles for both horizontal and vertical edges, in both their original and corrected forms. Bottom line, the D80 captures excellent detail, really making the most of its 10.2 megapixel sensor. You can't sharpen its camera-created JPEGs quite as much as those from the D200, but they're much crisper looking straight from the camera, as is appropriate for a DSLR aimed at the consumer market. That said, enthusiast shooters will be able to extract a lot of fine detail with a little playing around using Photoshop's unsharp masking operator or other image-sharpening application.


 Fujifilm GFX 50S Review
 Fujifilm X-T3 Review
 Olympus E-M5 III Review

Follow Imaging Resource