Canon XS Imatest Results
We routinely use Norman Koren's excellent "Imatest" analysis program for quantitative, thoroughly objective analysis of digicam test images. I highly recommend it to our technically-oriented readers, as it's far and away the best, most comprehensive analysis program I've found to date.
My comments below are just brief observations of what we see in the Imatest results. A full discussion of all the data Imatest produces is really beyond the scope of this review: Visit the Imatest web site for a full discussion of what the program measures, how it performs its computations, and how to interpret its output.
Here's some of the results produced by Imatest for the Canon Rebel XS:
sRGB Accuracy Comparison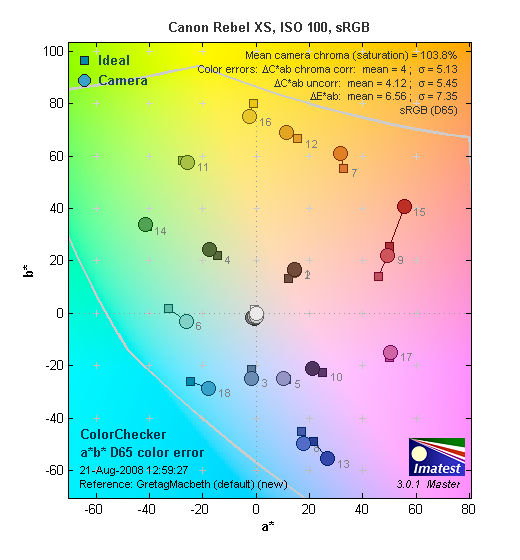 |
|||
The Canon XS showed very good color accuracy, as well as fairly accurate saturation levels. Hue accuracy was quite good, with most of the hue shift occurring in the reds and blue-green through cyan. Average saturation was 103.8% (3.8% oversaturated) and average "delta-C" color error was only 4 after correction for saturation, among the very best we've seen. (Delta-C is the same as the more commonly referred to delta-E, but delta-C takes into account only color differences, ignoring luminance variation.) Overall, an excellent color response for an SLR, especially a consumer oriented model. Mouse over the links below the illustration above to compare results with other recent models.
Adobe RGB Accuracy Comparison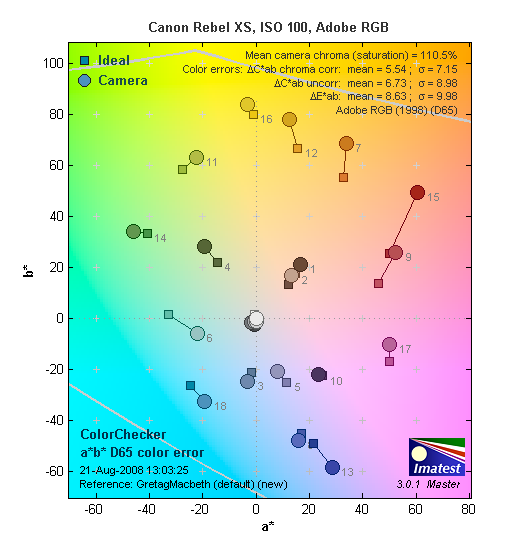 |
|||
As is true of most SLRs, when using the Adobe RGB color space (which provides a much wider gamut, or range of colors that can be expressed), the Canon XS delivers more highly saturated color, with an average saturation of 110.5% and average saturation-corrected hue error of 5.54 "delta-C" units. Again, mouse over the links below the illustration above to compare results with other recent SLRs.
Canon XS Color Analysis
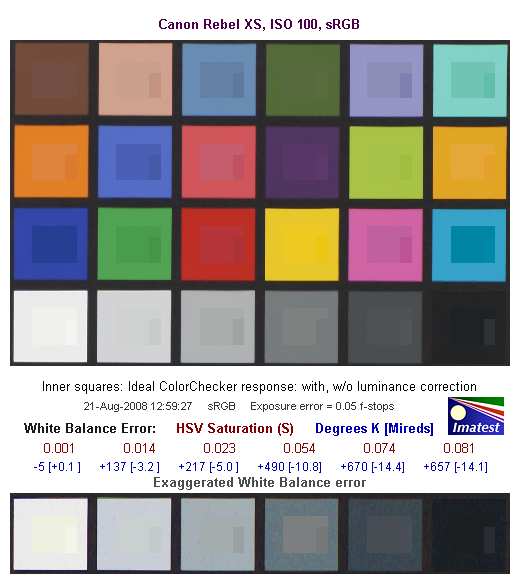
This image shows how the Canon XS actually rendered the colors of the MacBeth chart, compared to a numerically ideal treatment. In each color swatch, the outer perimeter shows the color as actually captured by the camera, the inner square shows the numerically ideal color, after correcting for the luminance of the photographed chart (as determined by a second-order curve fit to the values of the gray swatches), and the small rectangle inside the inner square shows the numerically ideal color, without any luminance correction. This image shows the very good hue accuracy, as well as a tendency to render colors a little lighter than their "ideal" values, making for brighter-looking photos that will appeal to most consumers. Overall though, the colors are impressively close to their "correct" values.
Canon XS Noise Analysis
There's a lot in this particular graph; as always, a lot more than we have room to go into here. (This set of plots has also changed a little in the more recent versions of Imatest. Some of the plots that were shown here previously are now shown in other Imatest output. Since we largely focus on the Noise Spectrum plot, we'll only show the graphic above, which includes that plot.)
In comparing these graphs with those from competing cameras, I've found that the Noise Spectrum graph at lower right is the most important. Cameras that manage to shift their noise spectrum to higher frequencies have much finer-grained noise structures, making their noise less visually objectionable. In the graph above, this would show up as a noise spectrum curve that remained higher on the right side, representing higher noise frequencies. The champion at this was the Canon EOS-1Ds Mark II, which produced remarkably fine-grained image noise, even at very high ISOs.
Luminance noise was very low, lower than much of the competition, and the XS did a good job at keeping plenty of the energy in the luminance channel at high frequency, which translates to a fine "grain" pattern and plenty of detail. However, chrominance noise energy is much higher at low frequencies, especially the red channel. This can be seen as some blotchiness in the Canon Rebel XS's images, even at low ISOs.
Here's the same set of noise data at ISO 1,600. Here, the Noise Spectrum graph for the luminance signal is shifted quite a bit more toward the left-hand, lower-frequency side than it was at ISO 100 (note how the whole graph is piled up on the left side of the plot), coarsening the "grain" of the image noise patterns. The red and blue channels still show more noise at lower frequencies than the green and luminance channels, which is somewhat unusual when high ISO noise reduction is active. (It's a bit more common for high-ISO noise reduction to flatten the noise more equally in all 3 channels.) When examining the XS's high ISO images, chrominance noise is more visible than some other competing models such as the Nikon D60, but the XS manages to hold onto a bit more detail.
This chart compares the Canon XS's noise performance over a range of ISOs against that of other cameras. While I continue to show noise plots of this sort because readers ask for them, I each time point out that the noise magnitude is only a small part of the story, the grain pattern being much more important. Here, we can see that the Canon XS's luminance noise magnitude is lower than all of the competition except at ISO 1,600, where it is about the same as the Nikon D60 and Olympus E-520. If this were a plot of chrominance noise, though, the XS's values would have been a good bit higher higher. Do keep in mind that these measurements are taken with each camera set at default settings, so the shape or position of the curve could be influenced by the settings you choose to use. The Pentax K200D's plot is a good example of this. Its luminance noise magnitude is higher than the others, but that's partly because the K200D's default contrast and sharpness settings are a bit on the high side, and even more because the K200D's high-ISO noise reduction defaults to Off.
Canon XS Dynamic Range Analysis
A key parameter in a digital camera is its Dynamic Range, the range of brightness that can be faithfully recorded. At the upper end of the tonal scale, dynamic range is dictated by the point at which the RGB data "saturates" at values of 255, 255, 255. At the lower end of the tonal scale, dynamic range is determined by the point at which there ceases to be any useful difference between adjacent tonal steps. Note the use of the qualifier "useful" in there: While it's tempting to evaluate dynamic range as the maximum number of tonal steps that can be discerned at all, that measure of dynamic range has very little relevance to real-world photography. What we care about as photographers is how much detail we can pull out of the shadows before image noise becomes too objectionable. This, of course, is a very subjective matter, and will vary with the application and even the subject matter in question. (Noise will be much more visible in subjects with large areas of flat tints and subtle shading than it would in subjects with strong, highly contrasting surface texture.)
What makes most sense then, is to specify useful dynamic range in terms of the point at which image noise reaches some agreed-upon threshold. To this end, Imatest computes a number of different dynamic range measurements, based on a variety of image noise thresholds. The noise thresholds are specified in terms of f-stops of equivalent luminance variation in the final image file, and dynamic range is computed for noise thresholds of 1.0 (low image quality), 0.5 (medium image quality), 0.25 (medium-high image quality) and 0.1 (high image quality). For most photographers and most applications, the noise thresholds of 0.5 and 0.25 f-stops are probably the most relevant to the production of acceptable-quality finished images, but many noise-sensitive shooters will insist on the 0.1 f-stop limit for their most critical work.
The image below shows the test results from Imatest for an in-camera JPEG file from the Canon XS with a nominally-exposed density step target (Stouffer 4110), and the XS's settings at their default positions.
These results are slightly below the current crop of SLRs with APS-C sized sensors The shape of the response curve is very good, with fairly gradual roll-off at both the high-light and shadow ends, but the relatively high red and blue channel noise impacts the dynamic range scores, keeping the camera from reaching the highest quality levels.
Processing the Canon XS's RAW (CR2) files through Adobe Camera Raw (ACR) version 4.5 improved dynamic range by 2/3 f-stop at the highest quality level. Most of the gain is due to ACR's default noise reduction, as overall dynamic range did not increase (it actually decreased from 11.2 to 11.1 f-stops). These results were obtained by using ACR's automatic settings; slightly better results may be possible by tweaking the sliders manually. (As always, it bears noting that extreme manipulation of RAW files to extend dynamic range can introduce severe color shifts in the resulting images: This dramatically increased dynamic range may only be really usable when converting the images to black and white. - As is the case with most cameras.)
Dynamic Range, the bottom line:
The net result was that the XS performed a little below average for in-camera JPEGs, and also slightly below average for processed RAW files. Still, not a bad performance for an entry-level model, but not quite as good as some competing models such as the Nikon D60. (It's also worth noting that the Canon Rebel XS does better than even some higher-end SLR models from previous generations, such as the Nikon D80, Canon's Rebel XTi, and even Canon's EOS-1DS Mark II.)
To get some perspective, here's a summary of the Canon XS's dynamic range performance, and how it compares to other digital SLRs that we also have Imatest dynamic range data for. (Results are arranged in order of decreasing dynamic range at the "High" quality level.):
| Dynamic Range (in f-stops) vs Image Quality (At camera's base ISO) (Blue = RAW via ACR, Yellow=Camera JPEG, Green=Current Camera) |
||||
| Model | 1.0 (Low) |
0.5 (Medium) |
0.25 (Med-High) |
0.1 (High) |
| Nikon D700 (Adobe Camera Raw 4.5) |
12.1 | 11.6 | 10.6 | 9.51 |
| Sony A900 (Adobe Camera Raw 4.6b) |
-- | 12.1 | 10.7 | 9.36 |
| Nikon D90 (Adobe Camera Raw 4.6b) |
12.1 | 11.8 | 10.7 | 9.27 |
| Fujifilm S3 Pro (Adobe Camera Raw 2) |
12.1 | 11.7 | 10.7 | 9.00 |
| Nikon D40x (Adobe Camera Raw 4.1) |
12.0 | 10.9 | 10.3 | 8.90 |
| Canon EOS-1Ds Mark III (Adobe Camera Raw 4.5) |
11.5 | 10.7 | 9.96 | 8.84 |
| Nikon D3 (Adobe Camera Raw 4.5) |
11.7 | 11.0 | 10.0 | 8.75 |
| Canon EOS-1D Mark III (Adobe Camera Raw 4.5) |
11.7 | 10.7 | 9.99 | 8.73 |
| Pentax K20D (Adobe Camera Raw 4.5) |
11.4 | 10.6 | 9.82 | 8.56 |
| 8.5 Stops | ||||
| Nikon D300 (Adobe Camera Raw 4.3.1) |
11.4 | 10.9 | 9.87 | 8.45 |
| Sony A200 (Adobe Camera Raw 4.3.1) |
11.6 | 10.4 | 9.82 | 8.43 |
| Nikon D60 (Adobe Camera Raw 4.4.1) |
11.6 | 10.5 | 9.74 | 8.31 |
| Nikon D40 (Adobe Camera Raw 4.1) |
11.9 | 10.9 | 9.89 | 8.30 |
| Canon EOS-1Ds Mark III (Camera JPEG) |
10.9 | 10.2 | 9.71 | 8.23 |
| Pentax K100D (Adobe Camera Raw 3.6) |
11.3 | 10.3 | 9.51 | 8.23 |
| Pentax K200D (Adobe Camera Raw 4.4.1) |
-- | 10.5 | 9.54 | 8.19 |
| Pentax K10D (Adobe Camera Raw 3.7) |
10.6 | 10.0 | 9.29 | 8.19 |
| Sony A100 (Adobe Camera Raw 3.4) |
11.3 | 10.5 | 9.69 | 8.16 |
| Canon EOS-1Ds Mark II (Adobe Camera Raw 3) |
11.2 | 10.3 | 9.40 | 8.14 |
| Canon EOS 50D (Adobe Camera Raw 4.6) |
11.2 | 10.5 | 9.49 | 8.06 |
| Nikon D40x (Camera JPEG) |
10.8 | 10.0 | 9.42 | 8.04 |
| Canon Rebel XSi (Camera JPEG) (ALO on by default) |
11.3 | 10.1 | 9.34 | 8.01 |
| 8.0 Stops | ||||
| Fujifilm S3 Pro (Camera JPEG) |
-- | 9.90 | 9.40 | 7.94 |
| Sony A350 (Adobe Camera Raw 4.4) |
11.6 | 10.5 | 9.61 | 7.89 |
| Canon EOS-1D Mark III (Camera JPEG) |
-- | 10.2 | 9.70 | 7.88 |
| Canon Rebel XS (Adobe Camera Raw 4.5) |
-- | 10.3 | 9.27 | 7.88 |
| Nikon D3 (Camera JPEG) |
-- | -- | -- | 7.87 |
| Canon Digital Rebel XTi (Adobe Camera Raw 3.6) |
10.8 | 9.88 | 9.18 | 7.84 |
| Canon EOS 5D (Adobe Camera Raw 3) |
11.0 | 10.4 | 9.21 | 7.83 |
| Canon EOS 50D (Camera JPEG) (ALO Off ) |
-- | 9.64 | 9.17 | 7.83 |
| Nikon D90 (Camera JPEG) |
-- | -- | -- | 7.77 |
| Canon EOS 40D (Adobe Camera Raw 4.2) |
11.2 | 10.1 | 9.26 | 7.72 |
| Canon Rebel XSi (Adobe Camera Raw 4.4.1) |
10.6 | 9.95 | 9.10 | 7.68 |
| Canon EOS 50D (Camera JPEG) (ALO STD by default) |
-- | -- | 8.90 | 7.68 |
| Nikon D700 (Camera JPEG) |
-- | -- | 9.05 | 7.67 |
| Canon EOS-5D (Camera JPEG) |
10.2 | 9.68 | 8.82 | 7.65 |
| Olympus E-3 (Adobe Camera Raw 4.3) |
10.3 | 10.1 | 9.29 | 7.64 |
| Nikon D60 (Camera JPEG) |
10.5 | 9.62 | 8.89 | 7.62 |
| Nikon D200 (Adobe Camera Raw 3) |
10.6 | 9.65 | 8.96 | 7.61 |
| Nikon D80 (Adobe Camera Raw 3.6) |
11.1 | 10.4 | 9.42 | 7.51 |
| 7.5 Stops | ||||
| Olympus E-500 (Adobe Camera Raw 3) |
10.7 | 9.97 | 8.90 | 7.46 |
| Olympus E-510 (Adobe Camera Raw 4.1) |
10.0 | 9.43 | 8.64 | 7.46 |
| Pentax K10D (Camera JPEG) |
-- | 9.49 | 8.88 | 7.44 |
| Nikon D300 (Camera JPEG) |
-- | -- | 8.70 | 7.44 |
| Nikon D2Xs (Adobe Camera Raw 3.6) |
10.6 | 9.90 | 8.93 | 7.42 |
| Canon EOS 40D (Camera JPEG) |
10.6 | 9.52 | 8.78 | 7.42 |
| Nikon D50 (Camera JPEG) |
10.7 | 9.93 | 8.70 | 7.36 |
| Panasonic DMC-G1 (Adobe Camera Raw 5.2) |
10.7 | 9.78 | 8.70 | 7.32 |
| Sony A900 (Camera JPEG) (DRO off by default ) |
10.2 | 9.75 | 8.49 | 7.31 |
| Sony A200 (Camera JPEG) (DRO on by default) |
10.4 | 9.43 | 8.91 | 7.29 |
| Canon EOS 20D (Camera JPEG) |
10.3 | 9.66 | 8.85 | 7.29 |
| Canon EOS 30D (Camera JPEG) |
10.3 | 9.50 | 8.57 | 7.29 |
| Nikon D40 (Camera JPEG) |
10.4 | 9.80 | 8.89 | 7.28 |
| Sony A900 (Camera JPEG) (DRO on) |
10.1 | 9.76 | 8.47 | 7.26 |
| Canon Rebel XS (Camera JPEG) |
10.3 | 9.4 | 8.61 | 7.22 |
| Sony A350 (Camera JPEG) (DRO on by default) |
10.3 | 9.55 | 8.85 | 7.19 |
| Nikon D80 (Camera JPEG) |
10.1 | 9.43 | 8.48 | 7.12 |
| Canon Digital Rebel XT (Camera JPEG) |
10.3 | 9.51 | 8.61 | 7.11 |
| Nikon D200 (Camera JPEG) |
-- | 9.07 | 8.36 | 7.11 |
| Panasonic DMC-G1 (Camera JPEG, iExposure = Low) |
-- | 9.29 | 8.50 | 7.09 |
| Panasonic DMC-G1 (Camera JPEG, iExposure = Standard) |
-- | 9.30 | 8.54 | 7.07 |
| Olympus E-300 (Camera JPEG) |
10.8 | 9.26 | 8.48 | 7.07 |
| Olympus E-410 (Adobe Camera Raw 4.1) |
10.2 | 9.40 | 8.24 | 7.05 |
| Olympus E-500 (Camera JPEG) |
10.0 | 9.14 | 8.16 | 7.05 |
| Canon Digital Rebel XTi (Camera JPEG) |
9.83 | 9.10 | 8.27 | 7.04 |
| Canon EOS-1Ds Mark II (Camera JPEG) |
10.3 | 9.38 | 8.60 | 7.04 |
| Panasonic DMC-G1 (Camera JPEG, iExposure = High) |
10.3 | 9.23 | 8.54 | 7.04 |
| Panasonic DMC-G1 (Camera JPEG, iExposure = Off) |
-- | 9.33 | 8.52 | 7.03 |
| Pentax K200D (Camera JPEG) |
-- | 9.50 | 8.30 | 7.01 |
| 7.0 Stops | ||||
| Canon Digital Rebel (Camera JPEG) |
10.1 | 9.11 | 8.47 | 6.97 |
| Nikon D2Xs (Camera JPEG) |
9.82 | 8.98 | 8.23 | 6.97 |
| Panasonic DMC-L10 (Adobe Camera Raw 4.2) |
10.4 | 9.34 | 8.48 | 6.91 |
| Sigma DP1 (Camera JPEG) |
-- | 8.95 | 8.13 | 6.91 |
| Pentax *istDs (Camera JPEG) |
10.2 | 10.0 | 8.87 | 6.90 |
| Sony A100 (Camera JPEG) |
10.2 | 9.24 | 8.39 | 6.89 |
| Pentax K100D (Camera JPEG) |
10.3 | 9.30 | 8.39 | 6.73 |
| Pentax K20D (Camera JPEG) |
10.2 | 9.21 | 8.09 | 6.66 |
| 6.5 Stops | ||||
| Nikon D2x (Camera JPEG) |
-- | 8.93 | 7.75 | 6.43 |
| Olympus E-3 (Camera JPEG) |
9.32 | 9.06 | 8.50 | 6.42 |
| Panasonic DMC-L10 (Camera JPEG) |
-- | 8.94 | 8.00 | 6.38 |
| Olympus E-420 (Camera JPEG) |
9.18 | 8.82 | 7.93 | 6.37 |
| 6.0 Stops | ||||
| Olympus E-410 (Camera JPEG) |
-- | -- | 7.60 | 5.99 |
| Nikon D70s (Camera JPEG) |
9.84 | 8.69 | 7.46 | 5.85 |
| Nikon D70 (Camera JPEG) |
9.81 | 8.76 | 7.58 | 5.84 |
| < 5.0 Stops | ||||
| Olympus E-510 (Camera JPEG) |
7.70 | 7.16 | 5.87 | 3.55 |
The results shown in the table are interesting. One of the first things that struck me when I initially looked at test data for a wide range of d-SLRs, was that here again, purely analytical measurements don't necessarily correlate all that well with actual photographic experience. There's no question that the Fuji S3 Pro deserves its place atop the list, as its unique "SR" technology does indeed deliver a very obvious improvement in tonal range in the highlight portion of the tonal scale. I was surprised to see the analytical results place the Olympus EVOLT as highly as they did, given that our sense of that camera's images was that they were in fact noisier than those of many other d-SLRs that we looked at. In the other direction, I was quite surprised to see the Nikon D2x place as low on the listings as it did, given that we found that camera's shadow detail to be little short of amazing. As time has gone on, we've found these numbers to be generally useful for quickly comparing different camera models. Don't place too much weight on minor differences in the numbers, though: You're not likely to be able to see much difference between two cameras, one with a rating of 7.2 stops, the other with a rating of 7.3. You'll very definitely see differences between cameras separated by a stop or more, though.
(Another thing that needs to be considered here is that we tested each camera at its lowest ISO setting, which should produce best-case noise levels. This is in fact what many photographers will be most interested in, but it does perhaps place some of the Nikons (like the D40) at a disadvantage, as their lowest ISO setting is 200, as compared to the ISO 100 settings available on most other models.)
Canon XS Resolution Chart Test Results
The chart above shows consolidated results from spatial frequency response measurements in both the horizontal and vertical axes. The "MTF 50" numbers tend to correlate best with visual perceptions of sharpness, so those are what I focus on here. The uncorrected resolution figures are 1,731 line widths per picture height in the horizontal direction (corresponding to the vertically-oriented edge), and 1,468 lines along the vertical axis (corresponding to the horizontally-oriented edge), for a combined average of 1,600 LW/PH. Correcting to a "standardized" sharpening with a one-pixel radius increased both vertical and horizontal resolution slightly, resulting in an average of 1,885 LW/PH, quite a bit below the best we've seen for a 10-megapixel camera.
To see what's going on, refer to the plots below, which show the actual edge profiles for both horizontal and vertical edges, in both their original and corrected forms. Here, you can see that there is some in-camera sharpening applied (the bump at the top ends of the black curves), that Imatest's standard sharpening operator improved upon. Imatest reported the horizontal direction was undersharpened by 7.46% while the vertical direction was undersharpened by 17%. (That said, though, while the slope of the edge profiles could have been more vertical, both horizontal and vertical edge show a slight bump in their density profiles. You'll thus see a slight light-colored halo around the edges of dark objects, limiting the amount of additional sharpening you can apply in Photoshop or other image-editing programs. Increasing the camera's sharpening would not be a good thing; you'll be better off if you decrease the sharpening (to eliminate the slight halo) and then sharpen post-capture in an image editing program.)
 Fujifilm GFX 50S Review
 Fujifilm X-T3 Review
 Olympus E-M5 III Review

Follow Imaging Resource