
Digital Cameras – Pentax K-S2 Test Images
Not sure which camera to buy? Let your eyes be the ultimate judge!
Visit our Comparometer(tm)
to compare images from the Pentax K-S2 with those from other
cameras you may be considering. The proof is in the pictures, so let
your own eyes decide which you like best!
|
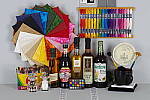
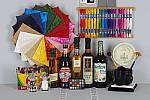
This is our new “Still Life” test target. We’re combining Here’s what to look for in this target:
|
|||||||||||||||||||||||||||||||||||||||||||||
|
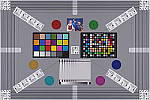
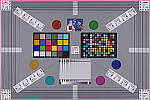
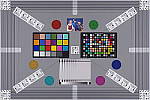
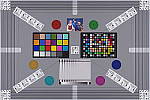
Our new “Multi Target” was first put into use in April, 2009, replacing the earlier “interim” design. This target incorporates a number of elements that combine aspects of the previous Multi target, as well as the previous Viewfinder Accuracy or “VFA” chart. Here’s some of what you’ll find in this target: Framing marks: This chart evolved from the earlier Viewfinder Accuracy chart, so one of its major uses is to measure viewfinder accuracy. (See notes in the Viewfinder Accuracy section, at the bottom of this page, for more information on this.) USAF resolution targets: An important use of this target is in evaluating lens quality, looking how well sharpness holds up as you move from the center to the corners of the frame. The little “USAF” resolution targets arranged at the center, in the corners, and along the diagonals are very useful for making fine judgements about blur, flare and aberrations in the image. We generally show crops of a USAF chip from a corner of the target and from the center, to show how lenses hold sharpness at wide and telephoto focal lengths. Alignment “bullseyes:” We find these graphics from the graphic arts world (used to align sheets of film in the old film-based prepress days) very useful for seeing chromatic aberration in lenses. The bold black/white elements are good for seeing the colored fringes caused by CA in the corners of the frame. MacBeth ColorChecker Chart: This is about as common a color standard as you can get these days, very widely available for only mildly exorbitant cost, and quite well controlled in its production. It thus serves as a good basis of comparison between cameras and between test setups. Imatest also understands the MacBeth colors very well, and uses them to produce its color accuracy map that we feature in all our reviews. MacBeth ColorChecker SG Chart: The ColorChecker SG chart provides a wider range of colors, to give a more detailed map of a camera’s color handling. We haven’t begun using this chart in the color-accuracy graphs we routinely offer, but expect to do so at some point in the future. In the meantime, we sometimes refer to this chart internally, to get a more complete idea of what a camera’s color map looks like. Log C/F Target: The progressive resolution pattern located just below the center of the target is a Log C/F (logarithmic contrast vs spatial frequency) chart. Digital camera noise reduction routines work by looking at levels of local contrast, flattening-out detail at progressively lower spatial frequencies as the local contrast decreases. (This is very commonly seen in human hair, grass, foliage, and other subjects with subtly-contrasting fine detail.) This chart lets Imatest analyze just how a camera makes the tradeoff between contrast, detail, and image noise. Color Starbursts: The six circular starburst elements arranged around the target are intended to reveal de-mosaicing artifacts and color-dependent resolution issues. The six starbursts provide examples of each combination of RGB colors intersecting each other. (That is, red, green, and blue against black, plus red against green, green against blue, and blue against red.) Given that the most common sensor RGB color filter pattern (the so-called Bayer) pattern has twice as many green pixels as red or blue, you’ll generally see that the green/black starburst shows the best resolution, while the blue/red one shows the worst. The effects of different sensor geometries and color filter array patterns will be revealed here. Musicians Image: Synthetic test patterns only tell you so much. While we have a lot of pictorial images in our other test targets, we thought it would be useful to include a small “natural” image here as well.
|
|||||||||||||||||||||||||||||||||||||||||||||
|
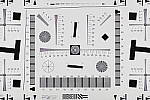
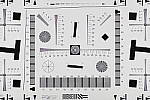
Part of the impetus in developing the new Multi Target in April 2009 was to switch to using a new 2x target for the resolution measurements, since the original ISO 12233 chart we’d used since the site first began in 1998(!) had become inadequate for testing the highest-resolution cameras. We’d for quite some time had a “homemade” 2x target, employing a shrunk version of the ISO 12233 chart, shot at 1/2 size. The resolution numbers on that chart all needed to be doubled to convert to the actual values, though, so we decided to go with a commercial 2x target to eliminate possible confusion on the part of our readers. Numbers on this new 2x resolution chart now read directly in hundreds of lines/picture height. (Because almost all of the area of this new resolution chart is now meaningful for resolution measurements, there was no longer space on it to overlay the MacBeth and other color targets on our prior Multi chart; hence the simultaneous change in our Multi target.)
|
|||||||||||||||||||||||||||||||||||||||||||||
|
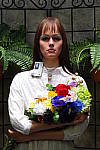
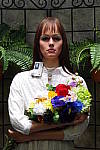
“Sunlit” Portrait The lighting in this shot is deliberately awful, about what you’d expect The reason for the harsh lighting is to provide a real “torture Look for:
To view the entire exposure series from -0.7 EV to +1.0 EV, see files KS2OUTAM2.HTM through KS2OUTBAP3.HTM on the thumbnail
|
|||||||||||||||||||||||||||||||||||||||||||||
Indoor Portrait, Flash
This shot duplicates indoor shooting conditions in most US homes, with Finally, exposure is important here, and frequently a tough challenge Note too, that the normal flash shot (as opposed to the slow sync one, To view the exposure series from zero to +1.0 EV in the normal flash To view the same series in the Slow-Sync flash mode, see files /cameras/pentax-k-s2-review/image/663551?section=samples |
|||||||||||||||||||||||||||||||||||||||||||||
Indoor Portrait, No Flash
The incandescent lighting used in most US homes actually has a very The incandescent lighting used for this shot is thus not only very common Most cameras’ auto white balance systems have a great deal of difficulty If you intend to do much shooting indoors after dark, pay careful attention To view the entire exposure series from zero to +1.0 EV, see files KS2INBMP0.HTM through KS2INBMP3.HTM on the thumbnail ISO Series One additional note about this particular test series though: Because
|
|||||||||||||||||||||||||||||||||||||||||||||
House Shot
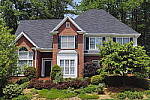
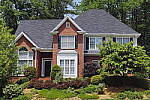
Like several of our tests, these images are actually photos of a high-resolution poster, shot under studio lighting. The shots for this camera were captured with our third-generation House poster, which was assembled from 45 separate 11-megapixel images, shot with a very high-quality lens, and then stitched together into a single image. The resulting image amounts to about 450 very high-quality megapixels. This should have sufficient detail to comfortably challenge cameras up to at least 80-100 megapixels. (And even with higher-resolution cameras, we believe that the camera lenses themselves would be more likely to limit resolution than would the detail in the poster.) Why did we choose to shoot a picture of a picture? The idea was to show a typical subject (a house and surrounding foliage) in a way that would be absolutely consistent from camera to camera. Any outdoor subject is going to vary considerably from day to day, as the lighting changes with the weather, atmospheric conditions, and season. Shooting a poster lets us compare images from cameras shot weeks, months, or even years apart, with the sure knowledge that nothing has changed from one shot to another. Things to look for here are fine detail, as seen in the foliage and tree limbs against the sky, sharpness in the corners, and the preservation of subtle detail in the shaded brick patterns. – Many cameras with overactive noise suppression severely blur the brick patterns that are in shadow. |
|||||||||||||||||||||||||||||||||||||||||||||
Far Field Test 2
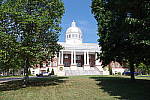
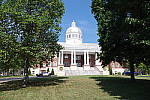
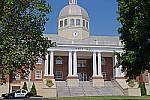
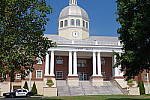
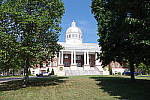
While the House poster in the shot above provides absolute repeatability from test to test, it doesn’t offer the range of brightness (dynamic range) that the original scene had, nor does it contain the nearly infinite range of fine detail found in nature. For these reasons, we shoot an outdoor photo of a building, to provide a more challenging (if more variable) subject for the cameras. Until Summer of 2011, we used the original house from the House poster for this “Far Field” shot, but the ever-encroaching trees made it less and less useful. The coup de grace for that subject was when the neighbor across the street relandscaped his yard so we could no longer shoot from our original position. In place of the original house, we’ve switched to using the Roswell, GA City Hall building, which offers many of the elements of the original Far Field subject, but in a setting where we’re guaranteed access into the future, and without the threat of trees eventually obscuring the building. In this shot, we look at how the camera handles rendering of subtle detail (the bricks, both in the sunlight and in the deep shadows under the entryway roof), how it handles bright highlights (the white columns and reflections from the dome), and shadow detail (in the dark areas beneath the shrubs on either side of the steps). Note though, that because this is shot outdoors, the character of the light is unavoidably going to change quite a bit, depending on the atmospheric humidity and the time of year. – You thus shouldn’t rely on it for absolute comparisons between cameras, since it’s unlikely that conditions will be exactly the same from one test to the next.
|
|||||||||||||||||||||||||||||||||||||||||||||
|
Lens Zoom Range Simply reading “2.8x zoom range” doesn’t do a lot to help you visualize what that means. It also says nothing regarding just how wide the wide-angle end of that range is. To give you an idea of exactly what each camera’s zoom lens does, we shoot this series of images, showing results at maximum wide angle, maximum telephoto, and telephoto with “digital zoom” enabled. (If supported. Note of course though, that so-called “digital zoom” just crops out and enlarges the central pixels of the image, achieving increased size at the cost of reduced resolution.)
|
|||||||||||||||||||||||||||||||||||||||||||||
|
“Davebox” Test Target
Because most of its various elements are now contained or represented in the combination of the Still Life and Multi Target shots, we no longer routinely shoot the Davebox by itself, as would normally appear in this space. (We do however, still use it for our low light test below.) |
|||||||||||||||||||||||||||||||||||||||||||||
Macro Shot
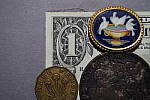
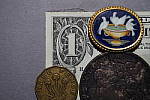
Many are interested in close-up or “macro” photography. This test shows the best results we could obtain using each camera’s macro mode. What to look for:
|
|||||||||||||||||||||||||||||||||||||||||||||
|
Low-Light Tests Low light photography is an area where there are really enormous differences between digital camera models. We used to shoot this test at all ISOs (in one EV steps) and five light levels but because cameras now often offer over a dozen ISO settings, the number of shots required was becoming unreasonable. So, this test is now shot at only three ISO settings (low, medium and high) and at the highest and lowest light levels we used to test at (a light level about equivalent to typical city street lighting at night (one foot-candle), and at 1/16 foot-candle where many cameras struggle). Shots in the rightmost column of the table below are taken with long exposure noise reduction disabled and high ISO noise reduction minimized. You may also see the effect of poor low-light autofocus in some of these shots, although we use a different test setup to check autofocus performance more directly. (The results of which are reported on in the main Test Results section.) Things to look for here include:
(Note: If you’d like to use a light meter to check light levels for subjects you might be interested in shooting, a light level of one foot-candle corresponds to a normal exposure of two seconds at f/2.8 and ISO 100.)
|
|||||||||||||||||||||||||||||||||||||||||||||
|
Manufacturer-Specified Flash Range Lately, many manufacturers specify flash range with the camera set to Auto mode, in which the camera is free to boost its ISO setting to help increase the flash range. This does increase the range, but it’s easy to have too much of a good thing: Too high an ISO can leave you with too much image noise. The variable ISO setting also means that there isn’t an easy way to compare the range with the fixed-ISO shots in our standard flash range series. So now, we also test the flash under the manufacturer-specified conditions (whatever they may be, but frequently with the camera set to Auto mode), and the look at both how brightly the scene is lit, and how much image noise is present in the resulting images. Flash range for SLRs will vary with the lens used (depending on the maximum aperture), so their flash range is commonly expressed as a Guide Number, or GN for short. The guide number is a distance, in either feet or meters, at a given ISO. To find the maximum flash range at a given aperture, just divide the guide number by the aperture. For instance, a guide number of 56 feet would translate to a range of 10 feet with a lens set to an aperture of f/5.6. The range would be twice that if you had an f/2.8 lens (56/2.8 = 20).
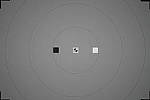
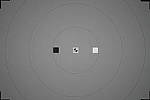
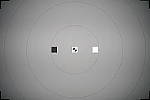
Flash Uniformity The flash units on many digital cameras don’t illuminate the scene very evenly, especially at wide angle focal lengths, so the photo here shows how uniform the flash coverage is. As noted earlier, this test uses the same target as our flash range test, but for the uniformity tests, we take care to frame the target the same from camera to camera. The concentric circles on the target mark distances 25%, 50%, and 75% of the way from the center to the corners. (Approximate, they roughly split the difference between the 4:3 and 3:2 aspect ratios.)
|
|||||||||||||||||||||||||||||||||||||||||||||
|
Viewfinder Accuracy Viewfinder accuracy is an important parameter, especially for shots Unlike the optical viewfinders, the LCD viewfinders on most digital Things to look for on this test chart are:
|
|||||||||||||||||||||||||||||||||||||||||||||










Digital Cameras – Pentax K-S2 Test Images
Not sure which camera to buy? Let your eyes be the ultimate judge!
Visit our Comparometer(tm)
to compare images from the Pentax K-S2 with those from other
cameras you may be considering. The proof is in the pictures, so let
your own eyes decide which you like best!
|
This is our new “Still Life” test target. We’re combining Here’s what to look for in this target:
|
|||||||||||||||||||||||||||||||||||||||||||||
|
Our new “Multi Target” was first put into use in April, 2009, replacing the earlier “interim” design. This target incorporates a number of elements that combine aspects of the previous Multi target, as well as the previous Viewfinder Accuracy or “VFA” chart. Here’s some of what you’ll find in this target: Framing marks: This chart evolved from the earlier Viewfinder Accuracy chart, so one of its major uses is to measure viewfinder accuracy. (See notes in the Viewfinder Accuracy section, at the bottom of this page, for more information on this.) USAF resolution targets: An important use of this target is in evaluating lens quality, looking how well sharpness holds up as you move from the center to the corners of the frame. The little “USAF” resolution targets arranged at the center, in the corners, and along the diagonals are very useful for making fine judgements about blur, flare and aberrations in the image. We generally show crops of a USAF chip from a corner of the target and from the center, to show how lenses hold sharpness at wide and telephoto focal lengths. Alignment “bullseyes:” We find these graphics from the graphic arts world (used to align sheets of film in the old film-based prepress days) very useful for seeing chromatic aberration in lenses. The bold black/white elements are good for seeing the colored fringes caused by CA in the corners of the frame. MacBeth ColorChecker Chart: This is about as common a color standard as you can get these days, very widely available for only mildly exorbitant cost, and quite well controlled in its production. It thus serves as a good basis of comparison between cameras and between test setups. Imatest also understands the MacBeth colors very well, and uses them to produce its color accuracy map that we feature in all our reviews. MacBeth ColorChecker SG Chart: The ColorChecker SG chart provides a wider range of colors, to give a more detailed map of a camera’s color handling. We haven’t begun using this chart in the color-accuracy graphs we routinely offer, but expect to do so at some point in the future. In the meantime, we sometimes refer to this chart internally, to get a more complete idea of what a camera’s color map looks like. Log C/F Target: The progressive resolution pattern located just below the center of the target is a Log C/F (logarithmic contrast vs spatial frequency) chart. Digital camera noise reduction routines work by looking at levels of local contrast, flattening-out detail at progressively lower spatial frequencies as the local contrast decreases. (This is very commonly seen in human hair, grass, foliage, and other subjects with subtly-contrasting fine detail.) This chart lets Imatest analyze just how a camera makes the tradeoff between contrast, detail, and image noise. Color Starbursts: The six circular starburst elements arranged around the target are intended to reveal de-mosaicing artifacts and color-dependent resolution issues. The six starbursts provide examples of each combination of RGB colors intersecting each other. (That is, red, green, and blue against black, plus red against green, green against blue, and blue against red.) Given that the most common sensor RGB color filter pattern (the so-called Bayer) pattern has twice as many green pixels as red or blue, you’ll generally see that the green/black starburst shows the best resolution, while the blue/red one shows the worst. The effects of different sensor geometries and color filter array patterns will be revealed here. Musicians Image: Synthetic test patterns only tell you so much. While we have a lot of pictorial images in our other test targets, we thought it would be useful to include a small “natural” image here as well.
|
|||||||||||||||||||||||||||||||||||||||||||||
|
Part of the impetus in developing the new Multi Target in April 2009 was to switch to using a new 2x target for the resolution measurements, since the original ISO 12233 chart we’d used since the site first began in 1998(!) had become inadequate for testing the highest-resolution cameras. We’d for quite some time had a “homemade” 2x target, employing a shrunk version of the ISO 12233 chart, shot at 1/2 size. The resolution numbers on that chart all needed to be doubled to convert to the actual values, though, so we decided to go with a commercial 2x target to eliminate possible confusion on the part of our readers. Numbers on this new 2x resolution chart now read directly in hundreds of lines/picture height. (Because almost all of the area of this new resolution chart is now meaningful for resolution measurements, there was no longer space on it to overlay the MacBeth and other color targets on our prior Multi chart; hence the simultaneous change in our Multi target.)
|
|||||||||||||||||||||||||||||||||||||||||||||
|
“Sunlit” Portrait The lighting in this shot is deliberately awful, about what you’d expect The reason for the harsh lighting is to provide a real “torture Look for:
To view the entire exposure series from -0.7 EV to +1.0 EV, see files KS2OUTAM2.HTM through KS2OUTBAP3.HTM on the thumbnail
|
|||||||||||||||||||||||||||||||||||||||||||||
Indoor Portrait, Flash
This shot duplicates indoor shooting conditions in most US homes, with Finally, exposure is important here, and frequently a tough challenge Note too, that the normal flash shot (as opposed to the slow sync one, To view the exposure series from zero to +1.0 EV in the normal flash To view the same series in the Slow-Sync flash mode, see files /cameras/pentax-k-s2-review/image/662811?section=test |
|||||||||||||||||||||||||||||||||||||||||||||
Indoor Portrait, No Flash
The incandescent lighting used in most US homes actually has a very The incandescent lighting used for this shot is thus not only very common Most cameras’ auto white balance systems have a great deal of difficulty If you intend to do much shooting indoors after dark, pay careful attention To view the entire exposure series from zero to +1.0 EV, see files KS2INBMP0.HTM through KS2INBMP3.HTM on the thumbnail ISO Series One additional note about this particular test series though: Because
|
|||||||||||||||||||||||||||||||||||||||||||||
House Shot
Like several of our tests, these images are actually photos of a high-resolution poster, shot under studio lighting. The shots for this camera were captured with our third-generation House poster, which was assembled from 45 separate 11-megapixel images, shot with a very high-quality lens, and then stitched together into a single image. The resulting image amounts to about 450 very high-quality megapixels. This should have sufficient detail to comfortably challenge cameras up to at least 80-100 megapixels. (And even with higher-resolution cameras, we believe that the camera lenses themselves would be more likely to limit resolution than would the detail in the poster.) Why did we choose to shoot a picture of a picture? The idea was to show a typical subject (a house and surrounding foliage) in a way that would be absolutely consistent from camera to camera. Any outdoor subject is going to vary considerably from day to day, as the lighting changes with the weather, atmospheric conditions, and season. Shooting a poster lets us compare images from cameras shot weeks, months, or even years apart, with the sure knowledge that nothing has changed from one shot to another. Things to look for here are fine detail, as seen in the foliage and tree limbs against the sky, sharpness in the corners, and the preservation of subtle detail in the shaded brick patterns. – Many cameras with overactive noise suppression severely blur the brick patterns that are in shadow. |
|||||||||||||||||||||||||||||||||||||||||||||
Far Field Test 2
While the House poster in the shot above provides absolute repeatability from test to test, it doesn’t offer the range of brightness (dynamic range) that the original scene had, nor does it contain the nearly infinite range of fine detail found in nature. For these reasons, we shoot an outdoor photo of a building, to provide a more challenging (if more variable) subject for the cameras. Until Summer of 2011, we used the original house from the House poster for this “Far Field” shot, but the ever-encroaching trees made it less and less useful. The coup de grace for that subject was when the neighbor across the street relandscaped his yard so we could no longer shoot from our original position. In place of the original house, we’ve switched to using the Roswell, GA City Hall building, which offers many of the elements of the original Far Field subject, but in a setting where we’re guaranteed access into the future, and without the threat of trees eventually obscuring the building. In this shot, we look at how the camera handles rendering of subtle detail (the bricks, both in the sunlight and in the deep shadows under the entryway roof), how it handles bright highlights (the white columns and reflections from the dome), and shadow detail (in the dark areas beneath the shrubs on either side of the steps). Note though, that because this is shot outdoors, the character of the light is unavoidably going to change quite a bit, depending on the atmospheric humidity and the time of year. – You thus shouldn’t rely on it for absolute comparisons between cameras, since it’s unlikely that conditions will be exactly the same from one test to the next.
|
|||||||||||||||||||||||||||||||||||||||||||||
|
Lens Zoom Range Simply reading “2.8x zoom range” doesn’t do a lot to help you visualize what that means. It also says nothing regarding just how wide the wide-angle end of that range is. To give you an idea of exactly what each camera’s zoom lens does, we shoot this series of images, showing results at maximum wide angle, maximum telephoto, and telephoto with “digital zoom” enabled. (If supported. Note of course though, that so-called “digital zoom” just crops out and enlarges the central pixels of the image, achieving increased size at the cost of reduced resolution.)
|
|||||||||||||||||||||||||||||||||||||||||||||
|
“Davebox” Test Target
Because most of its various elements are now contained or represented in the combination of the Still Life and Multi Target shots, we no longer routinely shoot the Davebox by itself, as would normally appear in this space. (We do however, still use it for our low light test below.) |
|||||||||||||||||||||||||||||||||||||||||||||
Macro Shot
Many are interested in close-up or “macro” photography. This test shows the best results we could obtain using each camera’s macro mode. What to look for:
|
|||||||||||||||||||||||||||||||||||||||||||||
|
Low-Light Tests Low light photography is an area where there are really enormous differences between digital camera models. We used to shoot this test at all ISOs (in one EV steps) and five light levels but because cameras now often offer over a dozen ISO settings, the number of shots required was becoming unreasonable. So, this test is now shot at only three ISO settings (low, medium and high) and at the highest and lowest light levels we used to test at (a light level about equivalent to typical city street lighting at night (one foot-candle), and at 1/16 foot-candle where many cameras struggle). Shots in the rightmost column of the table below are taken with long exposure noise reduction disabled and high ISO noise reduction minimized. You may also see the effect of poor low-light autofocus in some of these shots, although we use a different test setup to check autofocus performance more directly. (The results of which are reported on in the main Test Results section.) Things to look for here include:
(Note: If you’d like to use a light meter to check light levels for subjects you might be interested in shooting, a light level of one foot-candle corresponds to a normal exposure of two seconds at f/2.8 and ISO 100.)
|
|||||||||||||||||||||||||||||||||||||||||||||
|
Manufacturer-Specified Flash Range Lately, many manufacturers specify flash range with the camera set to Auto mode, in which the camera is free to boost its ISO setting to help increase the flash range. This does increase the range, but it’s easy to have too much of a good thing: Too high an ISO can leave you with too much image noise. The variable ISO setting also means that there isn’t an easy way to compare the range with the fixed-ISO shots in our standard flash range series. So now, we also test the flash under the manufacturer-specified conditions (whatever they may be, but frequently with the camera set to Auto mode), and the look at both how brightly the scene is lit, and how much image noise is present in the resulting images. Flash range for SLRs will vary with the lens used (depending on the maximum aperture), so their flash range is commonly expressed as a Guide Number, or GN for short. The guide number is a distance, in either feet or meters, at a given ISO. To find the maximum flash range at a given aperture, just divide the guide number by the aperture. For instance, a guide number of 56 feet would translate to a range of 10 feet with a lens set to an aperture of f/5.6. The range would be twice that if you had an f/2.8 lens (56/2.8 = 20).
Flash Uniformity The flash units on many digital cameras don’t illuminate the scene very evenly, especially at wide angle focal lengths, so the photo here shows how uniform the flash coverage is. As noted earlier, this test uses the same target as our flash range test, but for the uniformity tests, we take care to frame the target the same from camera to camera. The concentric circles on the target mark distances 25%, 50%, and 75% of the way from the center to the corners. (Approximate, they roughly split the difference between the 4:3 and 3:2 aspect ratios.)
|
|||||||||||||||||||||||||||||||||||||||||||||
|
Viewfinder Accuracy Viewfinder accuracy is an important parameter, especially for shots Unlike the optical viewfinders, the LCD viewfinders on most digital Things to look for on this test chart are:
|
|||||||||||||||||||||||||||||||||||||||||||||










All test shots
Pentax K-S2 Thumbnails
Not sure which camera to buy? Let your eyes be the ultimate judge!
Visit our Comparometer(tm)
to compare images from the Pentax K-S2 with those from other
cameras you may be considering. The proof is in the pictures, so let
your own eyes decide which you like best!
This page may take a long time to load, due to the many thumbnails!
All images copyright © 2015 by The Imaging Resource. All rights reserved.
 KS2FAR2AA0.JPG KS2FAR2AA0.DNG 11,422,929 bytes 5472×3648 1/400 sec f8.0 0.0 EV 35.0 mm focal length ISO 100 |
 KS2FAR2AA1.JPG KS2FAR2AA1.DNG 11,384,831 bytes 5472×3648 1/321 sec f8.0 0.0 EV 35.0 mm focal length ISO 100 |
 KS2FAR2AA2.JPG KS2FAR2AA2.DNG 12,714,200 bytes 5472×3648 1/321 sec f8.0 0.0 EV 35.0 mm focal length ISO 100 |
 KS2FAR2HC0.JPG 12,489,067 bytes 5472×3648 1/641 sec f8.0 0.0 EV 35.0 mm focal length ISO 200 |
 KS2FAR2HC1.JPG 12,686,945 bytes 5472×3648 1/641 sec f8.0 0.0 EV 35.0 mm focal length ISO 200 |
 KS2FAR2HCA.JPG 12,500,295 bytes 5472×3648 1/641 sec f8.0 0.0 EV 35.0 mm focal length ISO 200 |
 KS2FAR2HDR1.JPG 10,024,128 bytes 5472×3648 1/321 sec f8.0 0.0 EV 35.0 mm focal length ISO 100 |
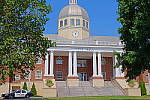 KS2FAR2HDR2.JPG 11,298,606 bytes 5472×3648 1/321 sec f8.0 0.0 EV 35.0 mm focal length ISO 100 |
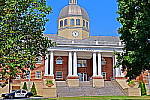 KS2FAR2HDR3.JPG 11,615,773 bytes 5472×3648 1/321 sec f8.0 0.0 EV 35.0 mm focal length ISO 100 |
 KS2FAR2HDRA.JPG 10,055,064 bytes 5472×3648 1/321 sec f8.0 0.0 EV 35.0 mm focal length ISO 100 |
 KS2FAR2I00100.JPG KS2FAR2I00100.DNG 11,474,208 bytes 5472×3648 1/321 sec f8.0 0.0 EV 35.0 mm focal length ISO 100 |
 KS2FAR2I00200.JPG KS2FAR2I00200.DNG 12,448,148 bytes 5472×3648 1/641 sec f8.0 0.0 EV 35.0 mm focal length ISO 200 |
 KS2FAR2I00400.JPG KS2FAR2I00400.DNG 12,190,521 bytes 5472×3648 1/1250 sec f8.0 0.0 EV 35.0 mm focal length ISO 400 |
 KS2FAR2I00800.JPG KS2FAR2I00800.DNG 11,932,614 bytes 5472×3648 1/2500 sec f8.0 0.0 EV 35.0 mm focal length ISO 800 |
 KS2FAR2I01600.JPG KS2FAR2I01600.DNG 12,442,274 bytes 5472×3648 1/5000 sec f8.0 0.0 EV 35.0 mm focal length ISO 1600 |
 KS2FAR2I03200.JPG KS2FAR2I03200.DNG 12,563,726 bytes 5472×3648 1/5000 sec f11.0 0.0 EV 35.0 mm focal length ISO 3200 |
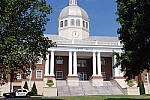 KS2FAR2I06400.JPG KS2FAR2I06400.DNG 11,822,152 bytes 5472×3648 1/5000 sec f16.0 0.0 EV 35.0 mm focal length ISO 6400 |
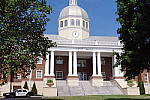 KS2FAR2I12800.JPG KS2FAR2I12800.DNG 10,245,135 bytes 5472×3648 1/5000 sec f22.0 0.0 EV 35.0 mm focal length ISO 12800 |
 KS2FAR2SC0.JPG 11,539,886 bytes 5472×3648 1/321 sec f8.0 0.0 EV 35.0 mm focal length ISO 100 |
 KS2FAR2SC1.JPG 11,712,169 bytes 5472×3648 1/321 sec f8.0 0.0 EV 35.0 mm focal length ISO 100 |
 KS2FAR2SC2.JPG 11,844,870 bytes 5472×3648 1/321 sec f8.0 0.0 EV 35.0 mm focal length ISO 100 |
 KS2FAR2SC3.JPG 11,967,247 bytes 5472×3648 1/321 sec f8.0 0.0 EV 35.0 mm focal length ISO 100 |
 KS2FAR2SCA.JPG 11,740,882 bytes 5472×3648 1/321 sec f8.0 0.0 EV 35.0 mm focal length ISO 100 |
 KS2FAR2WTM.JPG KS2FAR2WTM.DNG 12,676,560 bytes 5472×3648 1/400 sec f8.0 0.0 EV 34.0 mm focal length ISO 100 |
 KS2FAR2WTT.JPG KS2FAR2WTT.DNG 10,943,484 bytes 5472×3648 1/400 sec f8.0 0.0 EV 50.0 mm focal length ISO 100 |
 KS2FAR2WTW.JPG KS2FAR2WTW.DNG 11,601,378 bytes 5472×3648 1/160 sec f8.0 0.0 EV 18.0 mm focal length ISO 100 |
 KS2FLFCW.JPG 6,892,895 bytes 5472×3648 1/50 sec f4.0 0.0 EV 18.0 mm focal length ISO 200 |
 KS2FL_MFR070M0100.JPG 7,658,493 bytes 5472×3648 1/100 sec f5.6 0.0 EV 45.0 mm focal length ISO 100 |
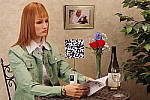 KS2INBAP0.JPG 11,803,719 bytes 5472×3648 1/5 sec f4.0 0.0 EV 70.0 mm focal length ISO 200 |
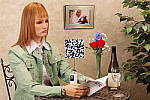 KS2INBAP1.JPG 11,881,988 bytes 5472×3648 1/4 sec f4.0 +0.3 EV 70.0 mm focal length ISO 200 |
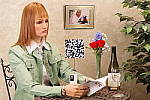 KS2INBAP2.JPG 11,873,905 bytes 5472×3648 0.3 sec f4.0 +0.7 EV 70.0 mm focal length ISO 200 |
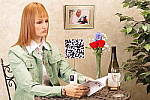 KS2INBAP3.JPG 11,745,046 bytes 5472×3648 0.4 sec f4.0 +1.0 EV 70.0 mm focal length ISO 200 |
 KS2INBFP0.JPG 12,220,770 bytes 5472×3648 1/125 sec f4.0 0.0 EV 70.0 mm focal length ISO 200 |
 KS2INBFP1.JPG 12,335,428 bytes 5472×3648 1/125 sec f4.0 0.0 EV 70.0 mm focal length ISO 200 |
 KS2INBFP2.JPG 12,260,701 bytes 5472×3648 1/125 sec f4.0 0.0 EV 70.0 mm focal length ISO 200 |
 KS2INBFP3.JPG 12,101,711 bytes 5472×3648 1/125 sec f4.0 0.0 EV 70.0 mm focal length ISO 200 |
 KS2INBFSP0.JPG 11,858,501 bytes 5472×3648 1/5 sec f4.0 0.0 EV 70.0 mm focal length ISO 200 |
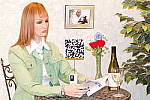 KS2INBFSP1.JPG 11,628,304 bytes 5472×3648 1/5 sec f4.0 0.0 EV 70.0 mm focal length ISO 200 |
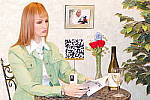 KS2INBFSP2.JPG 11,621,329 bytes 5472×3648 1/5 sec f4.0 0.0 EV 70.0 mm focal length ISO 200 |
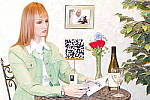 KS2INBFSP3.JPG 11,088,062 bytes 5472×3648 1/5 sec f4.0 0.0 EV 70.0 mm focal length ISO 200 |
 KS2INBI00100.JPG KS2INBI00100.DNG 12,505,232 bytes 5472×3648 0.4 sec f4.0 0.0 EV 70.0 mm focal length ISO 100 |
 KS2INBI00200.JPG KS2INBI00200.DNG 11,649,227 bytes 5472×3648 1/5 sec f4.0 0.0 EV 70.0 mm focal length ISO 200 |
 KS2INBI00400.JPG KS2INBI00400.DNG 11,462,725 bytes 5472×3648 1/10 sec f4.0 0.0 EV 70.0 mm focal length ISO 400 |
 KS2INBI00800.JPG KS2INBI00800.DNG 11,384,745 bytes 5472×3648 1/20 sec f4.0 0.0 EV 70.0 mm focal length ISO 800 |
 KS2INBI01600.JPG KS2INBI01600.DNG 11,610,406 bytes 5472×3648 1/40 sec f4.0 0.0 EV 70.0 mm focal length ISO 1600 |
 KS2INBI03200.JPG KS2INBI03200.DNG 11,938,584 bytes 5472×3648 1/80 sec f4.0 0.0 EV 70.0 mm focal length ISO 3200 |
 KS2INBI06400.JPG KS2INBI06400.DNG 9,996,826 bytes 5472×3648 1/160 sec f4.0 0.0 EV 70.0 mm focal length ISO 6400 |
 KS2INBI12800.JPG KS2INBI12800.DNG 11,213,190 bytes 5472×3648 1/400 sec f4.0 0.0 EV 70.0 mm focal length ISO 12800 |
 KS2INBI25600.JPG KS2INBI25600.DNG 12,544,916 bytes 5472×3648 1/641 sec f4.0 0.0 EV 70.0 mm focal length ISO 25600 |
 KS2INBI51200.JPG KS2INBI51200.DNG 11,399,924 bytes 5472×3648 1/1250 sec f4.0 0.0 EV 70.0 mm focal length ISO 51200 |
 KS2INBMP0.JPG 11,663,520 bytes 5472×3648 1/5 sec f4.0 0.0 EV 70.0 mm focal length ISO 200 |
 KS2INBMP1.JPG 11,748,096 bytes 5472×3648 1/4 sec f4.0 +0.3 EV 70.0 mm focal length ISO 200 |
 KS2INBMP2.JPG 11,769,969 bytes 5472×3648 0.3 sec f4.0 +0.7 EV 70.0 mm focal length ISO 200 |
 KS2INBMP3.JPG 11,618,976 bytes 5472×3648 0.4 sec f4.0 +1.0 EV 70.0 mm focal length ISO 200 |
 KS2INBTP0.JPG 11,662,160 bytes 5472×3648 1/5 sec f4.0 0.0 EV 70.0 mm focal length ISO 200 |
 KS2INBTP1.JPG 11,741,507 bytes 5472×3648 1/4 sec f4.0 +0.3 EV 70.0 mm focal length ISO 200 |
 KS2INBTP2.JPG 11,754,117 bytes 5472×3648 0.3 sec f4.0 +0.7 EV 70.0 mm focal length ISO 200 |
 KS2INBTP3.JPG 11,609,371 bytes 5472×3648 0.4 sec f4.0 +1.0 EV 70.0 mm focal length ISO 200 |
 KS2LL001003.JPG KS2LL001003.DNG 10,631,541 bytes 5472×3648 2 sec f2.8 0.0 EV 70.0 mm focal length ISO 100 |
 KS2LL001007.JPG KS2LL001007.DNG 10,821,734 bytes 5472×3648 30 sec f2.8 0.0 EV 70.0 mm focal length ISO 100 |
 KS2LL001007XNR.JPG KS2LL001007XNR.DNG 10,842,177 bytes 5472×3648 30 sec f2.8 0.0 EV 70.0 mm focal length ISO 100 |
 KS2LL032003.JPG KS2LL032003.DNG 11,277,053 bytes 5472×3648 1/15 sec f2.8 0.0 EV 70.0 mm focal length ISO 3200 |
 KS2LL032007.JPG KS2LL032007.DNG 11,325,575 bytes 5472×3648 1 sec f2.8 0.0 EV 70.0 mm focal length ISO 3200 |
 KS2LL032007XNR.JPG KS2LL032007XNR.DNG 11,762,330 bytes 5472×3648 1 sec f2.8 0.0 EV 70.0 mm focal length ISO 3200 |
 KS2LL512003.JPG KS2LL512003.DNG 11,767,567 bytes 5472×3648 1/250 sec f2.8 0.0 EV 70.0 mm focal length ISO 51200 |
 KS2LL512007.JPG KS2LL512007.DNG 11,642,425 bytes 5472×3648 1/15 sec f2.8 0.0 EV 70.0 mm focal length ISO 51200 |
 KS2LL512007XNR.JPG KS2LL512007XNR.DNG 11,873,560 bytes 5472×3648 1/15 sec f2.8 0.0 EV 70.0 mm focal length ISO 51200 |
 KS2MAC.JPG 12,590,252 bytes 5472×3648 1/80 sec f8.0 0.0 EV 50.0 mm focal length ISO 200 |
 KS2MACFL.JPG 11,031,003 bytes 5472×3648 1/100 sec f8.0 0.0 EV 50.0 mm focal length ISO 200 |
 KS2OUTBAM1.JPG KS2OUTBAM1.DNG 11,748,864 bytes 3648×5472 1/30 sec f8.0 -0.3 EV 70.0 mm focal length ISO 100 |
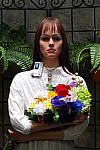 KS2OUTBAM2.JPG KS2OUTBAM2.DNG 11,585,286 bytes 3648×5472 1/30 sec f8.0 -0.7 EV 70.0 mm focal length ISO 100 |
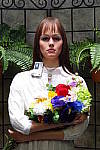 KS2OUTBAP0.JPG KS2OUTBAP0.DNG 11,925,951 bytes 3648×5472 1/25 sec f8.0 0.0 EV 70.0 mm focal length ISO 100 |
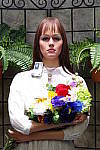 KS2OUTBAP1.JPG KS2OUTBAP1.DNG 11,898,901 bytes 3648×5472 1/15 sec f8.0 +0.3 EV 70.0 mm focal length ISO 100 |
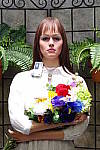 KS2OUTBAP2.JPG KS2OUTBAP2.DNG 11,864,749 bytes 3648×5472 1/15 sec f8.0 +0.7 EV 70.0 mm focal length ISO 100 |
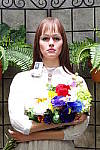 KS2OUTBAP3.JPG KS2OUTBAP3.DNG 11,867,889 bytes 3648×5472 1/13 sec f8.0 +1.0 EV 70.0 mm focal length ISO 100 |
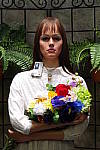 KS2OUTBDM1.JPG 11,748,869 bytes 3648×5472 1/30 sec f8.0 -0.3 EV 70.0 mm focal length ISO 100 |
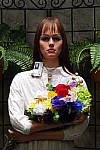 KS2OUTBDM2.JPG 11,521,716 bytes 3648×5472 1/30 sec f8.0 -0.7 EV 70.0 mm focal length ISO 100 |
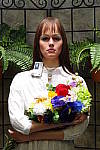 KS2OUTBDP0.JPG 11,863,555 bytes 3648×5472 1/25 sec f8.0 0.0 EV 70.0 mm focal length ISO 100 |
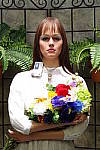 KS2OUTBDP1.JPG 11,844,282 bytes 3648×5472 1/15 sec f8.0 +0.3 EV 70.0 mm focal length ISO 100 |
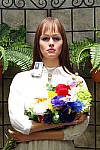 KS2OUTBDP2.JPG 11,821,385 bytes 3648×5472 1/15 sec f8.0 +0.7 EV 70.0 mm focal length ISO 100 |
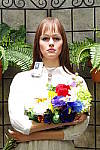 KS2OUTBDP3.JPG 11,919,304 bytes 3648×5472 1/13 sec f8.0 +1.0 EV 70.0 mm focal length ISO 100 |
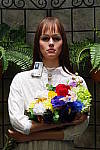 KS2OUTBHC1.JPG 11,290,641 bytes 3648×5472 1/60 sec f8.0 -0.3 EV 70.0 mm focal length ISO 200 |
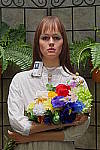 KS2OUTBHDR1.JPG 10,956,134 bytes 3648×5472 1/30 sec f8.0 -0.3 EV 70.0 mm focal length ISO 100 |
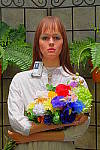 KS2OUTBHDR2.JPG 10,544,977 bytes 3648×5472 1/30 sec f8.0 -0.3 EV 70.0 mm focal length ISO 100 |
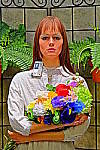 KS2OUTBHDR3.JPG 9,387,474 bytes 3648×5472 1/30 sec f8.0 -0.3 EV 70.0 mm focal length ISO 100 |
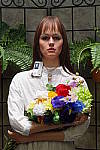 KS2OUTBHDRA.JPG 10,617,152 bytes 3648×5472 1/30 sec f8.0 -0.3 EV 70.0 mm focal length ISO 100 |
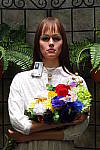 KS2OUTBMM1.JPG 11,744,073 bytes 3648×5472 1/30 sec f8.0 -0.3 EV 70.0 mm focal length ISO 100 |
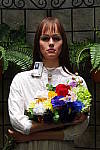 KS2OUTBMM2.JPG 11,478,133 bytes 3648×5472 1/30 sec f8.0 -0.7 EV 70.0 mm focal length ISO 100 |
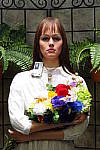 KS2OUTBMP0.JPG 11,889,182 bytes 3648×5472 1/25 sec f8.0 0.0 EV 70.0 mm focal length ISO 100 |
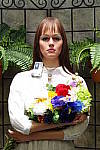 KS2OUTBMP1.JPG 11,855,403 bytes 3648×5472 1/15 sec f8.0 +0.3 EV 70.0 mm focal length ISO 100 |
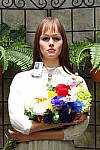 KS2OUTBMP2.JPG 11,852,992 bytes 3648×5472 1/15 sec f8.0 +0.7 EV 70.0 mm focal length ISO 100 |
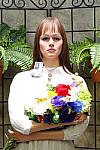 KS2OUTBMP3.JPG 11,874,028 bytes 3648×5472 1/13 sec f8.0 +1.0 EV 70.0 mm focal length ISO 100 |
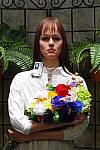 KS2OUTBSC1.JPG 11,870,913 bytes 3648×5472 1/30 sec f8.0 -0.3 EV 70.0 mm focal length ISO 100 |
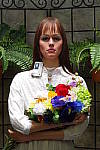 KS2OUTBSC2.JPG 11,971,886 bytes 3648×5472 1/30 sec f8.0 -0.3 EV 70.0 mm focal length ISO 100 |
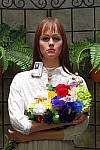 KS2OUTBSC3.JPG 11,776,069 bytes 3648×5472 1/30 sec f8.0 -0.3 EV 70.0 mm focal length ISO 100 |
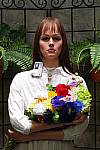 KS2OUTBSCA.JPG 11,863,127 bytes 3648×5472 1/30 sec f8.0 -0.3 EV 70.0 mm focal length ISO 100 |
 KS2OUTB_AUTO.JPG 10,398,473 bytes 3648×5472 1/200 sec f2.8 0.0 EV 70.0 mm focal length ISO 100 |
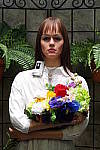 KS2OUTB_FACE.JPG 12,167,043 bytes 3648×5472 1/25 sec f8.0 0.0 EV 70.0 mm focal length ISO 100 |
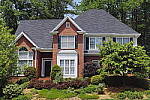 KS2hHOUSE.JPG KS2hHOUSE.DNG 11,941,545 bytes 5472×3648 1/25 sec f5.6 0.0 EV 70.0 mm focal length ISO 100 |
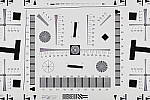 KS2hRES_AA0.JPG KS2hRES_AA0.DNG 8,634,996 bytes 5472×3648 1/30 sec f5.6 0.0 EV 70.0 mm focal length ISO 100 |
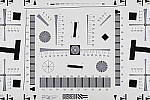 KS2hRES_AA0_ACRu150r03.JPG 7,276,370 bytes 5472×3648 1/30 sec f5.6 0.0 EV 70.0 mm focal length ISO 100 |
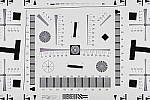 KS2hRES_AA1.JPG KS2hRES_AA1.DNG 8,572,239 bytes 5472×3648 1/30 sec f5.6 0.0 EV 70.0 mm focal length ISO 100 |
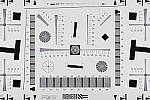 KS2hRES_AA2.JPG KS2hRES_AA2.DNG 8,365,289 bytes 5472×3648 1/30 sec f5.6 0.0 EV 70.0 mm focal length ISO 100 |
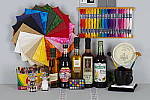 KS2hSLI00100NR0.JPG KS2hSLI00100NR0.DNG 11,240,394 bytes 5472×3648 1/15 sec f8.0 0.0 EV 70.0 mm focal length ISO 100 |
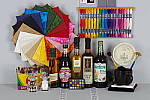 KS2hSLI00100NRAD.JPG KS2hSLI00100NRAD.DNG 11,240,212 bytes 5472×3648 1/15 sec f8.0 0.0 EV 70.0 mm focal length ISO 100 |
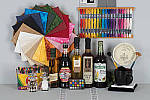 KS2hSLI00100_ACR.JPG 12,495,710 bytes 5472×3648 1/15 sec f8.0 0.0 EV 70.0 mm focal length ISO 100 |
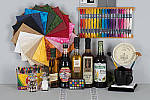 KS2hSLI00100_ACRu200r03.JPG 12,801,381 bytes 5472×3648 1/15 sec f8.0 0.0 EV 70.0 mm focal length ISO 100 |
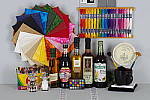 KS2hSLI00200NR0.JPG KS2hSLI00200NR0.DNG 10,727,857 bytes 5472×3648 1/30 sec f8.0 0.0 EV 70.0 mm focal length ISO 200 |
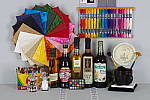 KS2hSLI00200NRAD.JPG KS2hSLI00200NRAD.DNG 10,676,233 bytes 5472×3648 1/30 sec f8.0 0.0 EV 70.0 mm focal length ISO 200 |
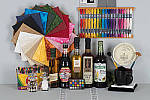 KS2hSLI00200_ACR.JPG 13,689,448 bytes 5472×3648 1/30 sec f8.0 0.0 EV 70.0 mm focal length ISO 200 |
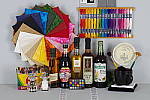 KS2hSLI00400NR0.JPG KS2hSLI00400NR0.DNG 12,575,194 bytes 5472×3648 1/60 sec f8.0 0.0 EV 70.0 mm focal length ISO 400 |
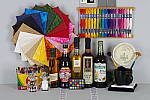 KS2hSLI00400NRAD.JPG KS2hSLI00400NRAD.DNG 12,499,907 bytes 5472×3648 1/60 sec f8.0 0.0 EV 70.0 mm focal length ISO 400 |
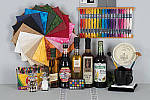 KS2hSLI00400_ACR.JPG 15,057,130 bytes 5472×3648 1/60 sec f8.0 0.0 EV 70.0 mm focal length ISO 400 |
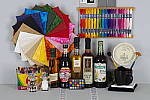 KS2hSLI00800NR0.JPG KS2hSLI00800NR0.DNG 12,439,320 bytes 5472×3648 1/125 sec f8.0 0.0 EV 70.0 mm focal length ISO 800 |
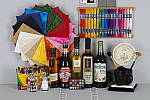 KS2hSLI00800NRAD.JPG KS2hSLI00800NRAD.DNG 12,413,923 bytes 5472×3648 1/125 sec f8.0 0.0 EV 70.0 mm focal length ISO 800 |
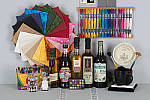 KS2hSLI00800_ACR.JPG 16,816,560 bytes 5472×3648 1/125 sec f8.0 0.0 EV 70.0 mm focal length ISO 800 |
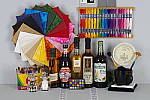 KS2hSLI01600NR0.JPG KS2hSLI01600NR0.DNG 9,752,896 bytes 5472×3648 1/250 sec f8.0 0.0 EV 70.0 mm focal length ISO 1600 |
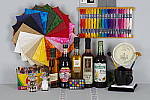 KS2hSLI01600NRAD.JPG KS2hSLI01600NRAD.DNG 10,965,382 bytes 5472×3648 1/250 sec f8.0 0.0 EV 70.0 mm focal length ISO 1600 |
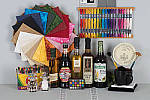 KS2hSLI01600_ACR.JPG 18,951,859 bytes 5472×3648 1/250 sec f8.0 0.0 EV 70.0 mm focal length ISO 1600 |
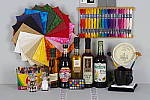 KS2hSLI03200NR0.JPG KS2hSLI03200NR0.DNG 10,050,692 bytes 5472×3648 1/500 sec f8.0 0.0 EV 70.0 mm focal length ISO 3200 |
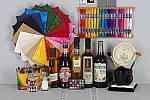 KS2hSLI03200NRAD.JPG KS2hSLI03200NRAD.DNG 9,758,284 bytes 5472×3648 1/500 sec f8.0 0.0 EV 70.0 mm focal length ISO 3200 |
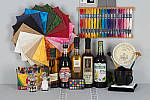 KS2hSLI03200_ACR.JPG 21,569,137 bytes 5472×3648 1/500 sec f8.0 0.0 EV 70.0 mm focal length ISO 3200 |
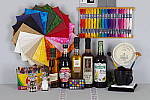 KS2hSLI06400NR0.JPG KS2hSLI06400NR0.DNG 12,453,425 bytes 5472×3648 1/1000 sec f8.0 0.0 EV 70.0 mm focal length ISO 6400 |
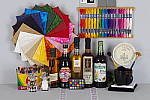 KS2hSLI06400NRAD.JPG KS2hSLI06400NRAD.DNG 12,036,014 bytes 5472×3648 1/1000 sec f8.0 0.0 EV 70.0 mm focal length ISO 6400 |
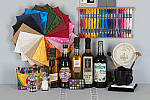 KS2hSLI06400_ACR.JPG 24,818,925 bytes 5472×3648 1/1000 sec f8.0 0.0 EV 70.0 mm focal length ISO 6400 |
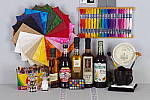 KS2hSLI12800NR0.JPG KS2hSLI12800NR0.DNG 10,067,983 bytes 5472×3648 1/2000 sec f8.0 0.0 EV 70.0 mm focal length ISO 12800 |
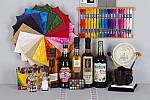 KS2hSLI12800NRAD.JPG KS2hSLI12800NRAD.DNG 11,783,584 bytes 5472×3648 1/2000 sec f8.0 0.0 EV 70.0 mm focal length ISO 12800 |
 KS2hSLI12800_ACR.JPG 25,460,892 bytes 5472×3648 1/2000 sec f8.0 0.0 EV 70.0 mm focal length ISO 12800 |
 KS2hSLI25600NR0.JPG KS2hSLI25600NR0.DNG 11,364,633 bytes 5472×3648 1/4000 sec f8.0 0.0 EV 70.0 mm focal length ISO 25600 |
 KS2hSLI25600NRAD.JPG KS2hSLI25600NRAD.DNG 10,085,401 bytes 5472×3648 1/4000 sec f8.0 0.0 EV 70.0 mm focal length ISO 25600 |
 KS2hSLI25600_ACR.JPG 29,865,291 bytes 5472×3648 1/4000 sec f8.0 0.0 EV 70.0 mm focal length ISO 25600 |
 KS2hSLI51200NR0.JPG KS2hSLI51200NR0.DNG 11,598,361 bytes 5472×3648 1/4000 sec f11.0 0.0 EV 70.0 mm focal length ISO 51200 |
 KS2hSLI51200NRAD.JPG KS2hSLI51200NRAD.DNG 11,294,879 bytes 5472×3648 1/4000 sec f11.0 0.0 EV 70.0 mm focal length ISO 51200 |
 KS2hSLI51200_ACR.JPG 34,986,138 bytes 5472×3648 1/4000 sec f11.0 0.0 EV 70.0 mm focal length ISO 51200 |
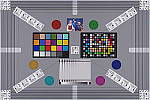 KS2hVFAI00100.JPG KS2hVFAI00100.DNG 11,954,361 bytes 5472×3648 1/30 sec f5.6 0.0 EV 70.0 mm focal length ISO 100 |
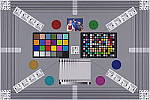 KS2hVFAI00200.JPG KS2hVFAI00200.DNG 11,669,499 bytes 5472×3648 1/60 sec f5.6 0.0 EV 70.0 mm focal length ISO 200 |
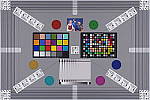 KS2hVFAI00400.JPG KS2hVFAI00400.DNG 11,788,839 bytes 5472×3648 1/125 sec f5.6 0.0 EV 70.0 mm focal length ISO 400 |
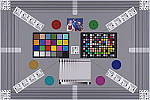 KS2hVFAI00800.JPG KS2hVFAI00800.DNG 12,114,569 bytes 5472×3648 1/250 sec f5.6 0.0 EV 70.0 mm focal length ISO 800 |
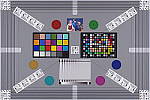 KS2hVFAI01600.JPG KS2hVFAI01600.DNG 12,671,538 bytes 5472×3648 1/500 sec f5.6 0.0 EV 70.0 mm focal length ISO 1600 |
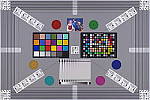 KS2hVFAI03200.JPG KS2hVFAI03200.DNG 10,181,635 bytes 5472×3648 1/1000 sec f5.6 0.0 EV 70.0 mm focal length ISO 3200 |
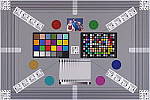 KS2hVFAI06400.JPG KS2hVFAI06400.DNG 11,392,344 bytes 5472×3648 1/2000 sec f5.6 0.0 EV 70.0 mm focal length ISO 6400 |
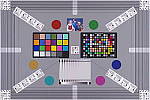 KS2hVFAI12800.JPG KS2hVFAI12800.DNG 11,374,612 bytes 5472×3648 1/4000 sec f5.6 0.0 EV 70.0 mm focal length ISO 12800 |
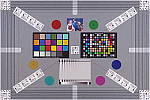 KS2hVFAI25600.JPG KS2hVFAI25600.DNG 11,104,851 bytes 5472×3648 1/4000 sec f8.0 0.0 EV 70.0 mm focal length ISO 25600 |
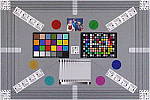 KS2hVFAI51200.JPG KS2hVFAI51200.DNG 11,477,837 bytes 5472×3648 1/4000 sec f11.0 0.0 EV 70.0 mm focal length ISO 51200 |
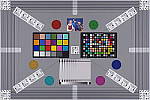 KS2hVFAL.JPG 11,919,346 bytes 5472×3648 1/30 sec f5.6 0.0 EV 70.0 mm focal length ISO 100 |
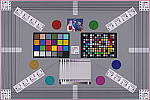 KS2hVFAO.JPG 11,865,001 bytes 5472×3648 1/30 sec f5.6 0.0 EV 70.0 mm focal length ISO 100 |
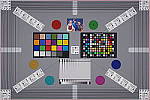 KS2hVFATB.JPG KS2hVFATB.DNG 11,421,082 bytes 5472×3648 1/25 sec f5.6 0.0 EV 50.0 mm focal length ISO 100 |
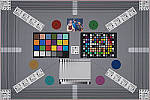 KS2hVFATB_ACRnc.JPG 9,210,941 bytes 5472×3648 1/25 sec f5.6 0.0 EV 50.0 mm focal length ISO 100 |
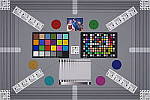 KS2hVFATB_DC1.JPG KS2hVFATB_DC1.DNG 10,238,827 bytes 5472×3648 1/25 sec f5.6 0.0 EV 50.0 mm focal length ISO 100 |
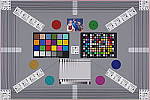 KS2hVFATB_PICA.JPG KS2hVFATB_PICA.DNG 11,511,127 bytes 5472×3648 1/25 sec f5.6 0.0 EV 50.0 mm focal length ISO 100 |
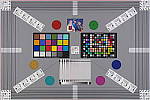 KS2hVFATS.JPG KS2hVFATS.DNG 11,668,533 bytes 5472×3648 1/13 sec f8.0 0.0 EV 50.0 mm focal length ISO 100 |
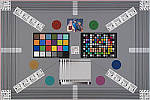 KS2hVFATS_ACRnc.JPG 9,458,017 bytes 5472×3648 1/13 sec f8.0 0.0 EV 50.0 mm focal length ISO 100 |
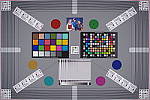 KS2hVFAWB.JPG KS2hVFAWB.DNG 11,175,058 bytes 5472×3648 1/50 sec f4.0 0.0 EV 18.0 mm focal length ISO 100 |
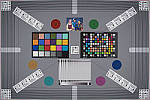 KS2hVFAWB_ACRnc.JPG 9,358,174 bytes 5472×3648 1/50 sec f4.0 0.0 EV 18.0 mm focal length ISO 100 |
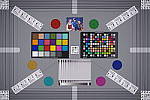 KS2hVFAWB_DC1.JPG KS2hVFAWB_DC1.DNG 9,922,636 bytes 5472×3648 1/50 sec f4.0 0.0 EV 18.0 mm focal length ISO 100 |
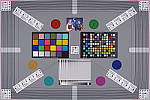 KS2hVFAWB_PICA.JPG KS2hVFAWB_PICA.DNG 11,239,059 bytes 5472×3648 1/50 sec f4.0 0.0 EV 18.0 mm focal length ISO 100 |
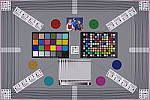 KS2hVFAWS.JPG KS2hVFAWS.DNG 12,238,336 bytes 5472×3648 1/13 sec f8.0 0.0 EV 18.0 mm focal length ISO 100 |
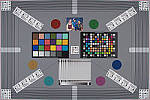 KS2hVFAWS_ACRnc.JPG 10,240,329 bytes 5472×3648 1/13 sec f8.0 0.0 EV 18.0 mm focal length ISO 100 |
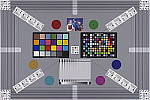 KS2hVFA_ADOBE.JPG KS2hVFA_ADOBE.DNG 11,631,857 bytes 5472×3648 1/15 sec f8.0 0.0 EV 70.0 mm focal length ISO 100 |
All images copyright © 2015 by The Imaging Resource. All rights reserved.