How we test Lenses at The Imaging Resource
posted Wednesday, October 15, 2008 at 7:08 PM EDT
At the heart of the lens testing we do here at The Imaging Resource lies some incredible mathematics and computer technology, developed by DxO Labs. DxO has developed technology that lets them characterize the optical performance of lens/camera systems with greater depth and breadth than almost anything that's gone before. Not only that, but their DxO Analyzer software largely automates the process, insuring accuracy and repeatability, and reducing literally billions of calculations to the click of a mouse.
Our own unique contribution has been to take the mass of numbers that DxO Analyzer spits out and turn them into 2-D and 3-D graphs that are easy to understand. Our goal was to make it easy to see visually what's going on with a lens as its focal length and aperture are varied. (Special thanks to Arthur Etchells for lending his programming prowess to the project.)
Here's a brief overview of how the DxO testing process works:
The target and test setup
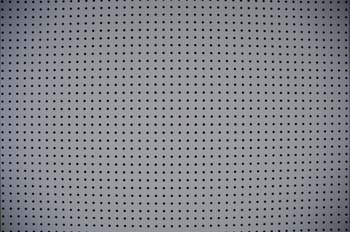
The whole process begins with a deceptively simple target: An array of very precisely placed, computer-generated dots, mounted on a dimensionally stable substrate (it's very flat), maintained in a controlled-humidity environment. Humidity control is important to prevent any distortion or warping of the test pattern.
The test target (shown above) is illuminated by incandescent bulbs in a set of soft boxes, with the brightness level controlled to plus or minus a tenth of an f-stop across the entire target area. (The precisely uniform lighting is essential to the measurement of shading or vignetting in the lenses under test.)
The target is shot with one of several reference digital SLRs, using consistent camera settings for exposure, ISO, contrast, and in-camera sharpening. Anywhere from three to nine shots are captured at each combination of aperture and focal length, to eliminate any possible shot-to-shot variation due to camera vibration. The camera is mounted on a very heavy-duty Bogen 3245 tripod with a 30-lb weight slung from it to increase stability and reduce vibration. Depending on the lens involved, the focus setting may also be micro-bracketed between groups of shots, to prevent any focus error in the camera from affecting the test results. For each lens tested, anywhere from dozens to hundreds of test images are captured and fed to the next stage of the process.
DxO Analyzer

At the heart of entire test process lies DxO Analyzer, a piece of software that analyzes the test images. Because the test pattern is so precisely defined, DxO Analyzer can determine exactly where each dot in the image should be, and exactly what shape it should be: a perfect circle. The precision of the target lets DxO detect the slightest distortion or aberration caused by the lens. Because the program knows exactly where each dot lies to sub-pixel accuracy, it can determine just how the brightness falls off as you move from the white background to the black of the dots' interiors. The sharper the image cast by the lens onto the sensor, the more abruptly this "edge profile" will transition from light to dark. DxO Analyzer can thus not only measure sharpness with unprecedented precision, but can determine how it varies across the focal plane.
This simplistic description hides a lot of sophisticated mathematics, though: DxO Analyzer does a lot heavy lifting behind the scenes to accomplish what we've just described. Fortunately, we don't need to know how it works, just that it does, and that its numbers are very repeatable from test to test.
The Imaging Resource graphing and display software
Given the mass of data it's dealing with, it is perhaps no surprise that the data output from DxO Analyzer is a mind-numbing pile of numbers. There's an incredible amount of information there; extracting and understanding it is far from easy.
This is where we thought we could help. Photographers are nothing if not visual. How better to show optical performance than visually? We wrote software that takes the raw numbers output by DxO Analyzer and turns them into 3D and 2D graphs. In particular, the blur data showing sharpness across the focal plane is transformed into 3-D surface plots to show exactly how the sharpness changes across the image.
Because lens performance also varies with aperture and focal length (in the case of zoom lenses), we also needed a convenient way to display this behavior as well. The solution was to create a viewer using Flash technology that lets readers scroll through test results at various combinations of focal length and aperture, and see how the "blur map" changes as a result.
(Special thanks to Arthur Etchells for his work on the 3D graphing software, and to Eugenia Broome for the excellent Flash viewer she devised for us.)
Tests Performed
DxO Analyzer makes a variety of measurements on the test images. Here's what they are, and the way in which the data is presented.
Blur Measurements (BxU Units)
Sharpness is probably the first characteristic anyone thinks of when considering lens quality, and it's here that the combination of DxO Analyzer with our own graphing and display software shows the most revealing results.
Sharpness is a tricky parameter to nail down mathematically, as it involves not only the fineness of detail that can be captured, but the "crispness" of the images in question. Crispness can best be thought of as how abruptly transitions from light to dark or dark to light occur. In our camera-testing work at Imaging Resource, it's been clear for years now that cameras that perform well on resolution test charts don't necessarily produce images that we perceive as being "sharp."
To address this issue, the image scientists at DxO came up with a measurement they call the "Blur Experience Unit," or "BxU." BxUs are a mathematical measurement that correlates very well with human perceptions of image sharpness. One BxU roughly corresponds to a "blur more" operation in Photoshop.
The DxO Analyzer software provides BxU measurements at 17 points across the frame, as shown above. A data set of this sort is produced for every combination of aperture and focal length tested, and the results from multiple shots are averaged together to improve accuracy. (The data above happens to be from a Tamron 18-200mm F/3.5-6.3 lens at 28mm and f/8.)
Working from the 17 data points provided by DxO Analyzer, our software creates a 64x64 mesh which in turn is used to create a surface plot of the blur across the frame. This makes the amount and distribution of blur across the frame immediately obvious. (The graph above displays the same data as shown immediately above, but this time rendered as a 3-D surface plot.)
A blur plot is generated for each combination of focal length and aperture tested, and the resulting graphs are loaded into a Flash-based viewer utility, that lets readers scroll through the plots to see where the lens is at its best and worst, making it easy to compare performance between different lenses.
Chromatic Aberration
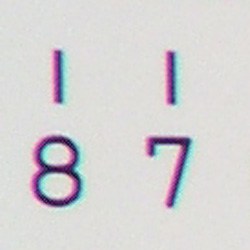
Chromatic aberration (CA for short) is caused by a lens not bringing the different colors of light into focus at exactly the same point. This results in colored fringes around high-contrast objects, most often seen in the corners of shots captured with wide angle lenses. (You can certainly find CA at normal or telephoto focal lengths as well, but most people will have seen it in their wide-angle shots.)
 |
 |
|
Fairly severe magenta/cyan chromatic aberration
|
Less severe yellow/blue chromatic aberration
|
The CA data provided by DxO Analyzer isn't as detailed as that for blur: The application just reports the maximum and average CA it finds in each image. These are still very useful numbers though, as they show just how bad the CA gets, and (indirectly) how much of the image it affects. Some lenses will produce large amounts of CA in the corners of the frame, but it quickly goes away as you move toward the center. In this case, you'd see a relatively high number for the maximum CA, but a relatively low one for the average. Conversely, some lenses may be better-behaved in the corners, but have higher levels of CA across the frame. Such lenses would show lower numbers for maximum CA values, but higher ones for average CA.
DxO Analyzer provides CA data in several different units. We use numbers that are expressed as percentages of the frame height, as these values are reported with more significant digits. Our plots (see above) display maximum and average CA across a range of apertures, with separate plots for each focal length tested. (The plot above is again from the Tamron 18-200mm f/3.5-6.3 lens, at 28mm.)
Since Analyzer only gives us two numbers for each aperture/focal length combination, there's no need to make a 3-D plot. We experimented with showing the CA results on a single graph, but with some wide-range zoom lenses, we found that the ten or so separate graph lines made for a confusing presentation. Also, having all the data on a single sheet made it difficult to visualize how the performance changed as focal length was varied. We finally settled on making a separate graph for each focal length setting, each graph showing how the CA varied with aperture. A modification of our viewer application (with only a single slider for focal length) lets readers scroll through the available focal lengths (for zoom lenses) and watch the CA curves move up and down accordingly.
Vignetting (Shading)
Some lenses, particularly wide-angle, show some light falloff at the corners or edges of the frame. This is commonly known as "vignetting," although a more correct term is "shading." With the test target illumination uniform to plus or minus 1/10th of an f-stop, DxO Analyzer can measure the amount of light falloff very precisely. The program reports the maximum light falloff it finds, in units of f-stops of exposure. The image below shows a resampled version of one of our actual test images, clearly showing shading. (The shot below is from a Nikkor 18-70mm f/3.5-4.5, wide open at 18mm.)
Vignetting commonly varies with both aperture and focal length. People are probably most accustomed to seeing vignetting in their wide angle shots, but it can occur at any focal length, depending on the trade-offs made by the lens designers.
Our graphs plot vignetting vs. aperture, with a separate line for each focal length. The illustration above shows an example vignetting plot for the Nikkor 18-70mm f/3.5-4.5 DX, which first shipped as the "kit" lens with the D70. It shows a fair bit of falloff wide open at 18mm (about a full f-stop), but stopping down to f/5.6 cuts the vignetting almost in half, and at longer focal lengths, the vignetting is negligible.
Geometric Distortion
Often referred to simply as "distortion," this refers to the tendency for lenses to bend lines close to the edges of the frame inward or outward. When lines near the edges of the frame bulge outward, the result is called "barrel distortion," and when they bend inward, it's called "pincushion distortion."

The image above (courtesy DxO) shows a rather severe example of barrel distortion, causing the vertical columns at the edges of the frame to bulge outward at their centers, and the straight lines of the floor tiles to appear curved.
DxO follows long-standing convention, and reports distortion as positive (barrel) or negative (pincushion) numbers, measuring the distortion as ratio between the deviation from a straight line and the length of the line being considered, expressed as a percentage. (This is the same measure we use on the Imaging Resource website. The simplest case would be if you drew a line across the entire width of the frame, and measured the deviation at its middle. Dividing that deviation by the width of the frame would give you the distortion as a dimensionless percentage.) Since distortion isn't a function of aperture, we simply plot it vs. focal length. In most cases lenses show barrel distortion at wide angle settings, and pincushion at telephoto.
The plot above shows our old friend the Tamron 18-200mm. Note that there are two lines on the chart, one showing maximum distortion, the other the average value. The average value is the average of the absolute value of the deviation of points from their ideal positions across the focal plane. (That is, it's showing how much deviation there is on average, regardless of direction.) The plot above is fairly typical. At wide angle, it's hard to design lenses without a moderate amount of barrel distortion. One percent barrel distortion is about as much leeway as most lens designers give themselves. Personally, we find pincushion distortion more disconcerting, the roughly one-half percent shown by the Tamron 18-200 is about as much as we like to see.
How you feel about geometric distortion will depend a lot on the type of subjects you shoot. Architectural photographers are naturally very averse to any distortion of this sort. If you mainly shoot mountains and meadows, you may not care much about it at all. (And if you really need distortion-free images, DxO sells a really remarkable piece of software called DxO Optics Pro (rebranded as DxO PhotoLab) that can correct not only distortion but chromatic aberration and even quite a bit of lens blur as well. Visit their site for all the details.)