Interpreting our Lens Testing results
posted Wednesday, October 15, 2008 at 4:22 PM EDT
Important points to consider in interpreting our test results
Test results are difficult to compare between different camera platforms
By its nature, DxO Analyzer is measuring the end results of the entire optical/image processing chain. The camera and its settings are therefore an integral part of the overall measurement. Different cameras and different settings will produce different Blur Experience Units! (From here on we'll call Blur Experience Units "BxU".) This means that the BxU numbers we report are NOT absolutes, but must be taken as relative values, a product not only of the lens in question, but of the specific camera and settings used to capture the test images as well.
Because of the relative nature of the DxO blur measurements, you can't directly equate results obtained on different camera platforms. By careful choice of the camera settings and the assignment of a relative scaling factor, we've brought the blur numbers for the different camera platforms we use into reasonably close agreement. We have no adequate way to precisely calibrate the BxU numbers between platforms though.
We arrived at the multipliers by looking at best-case performance with the same lens on the different camera platforms. The scaling factors were set to make this best-case performance roughly the same between the cameras in question. When this article was originally written in October, 2005, our test platforms were the Canon EOS-20D and the Nikon D2x: Since then, we've adopted the latest bodies between all the major manufacturers in both sub- and full-frame bodies. This means that numbers within a BxU unit or so of each other between multiple platforms have to be considered as nearly equivalent. That is, it's meaningless to say (for instance) that a particular Canon lens tested on the EOS-20D and showing a best-case BxU value of 1.5 is "better" than a Nikon lens tested on the D2x body and showing a best-case BxU value of 1.8. For this reason, we show only graphical results rather than numeric ones, and actively discourage people from making quantitative comparisons between lenses based on our data.
What can you tell from our tests?
So if exact comparisons aren't possible, what sorts of things can you tell from our tests? - In practice, it turns out that a difference of one BxU unit or so is quite a bit less than the differences in sharpness caused by even relatively minor changes in settings for in-camera sharpening or by surprisingly minute focus errors.
Fortunately, the loss of sharpness from typical optical defects and design shortcomings is glaringly obvious, amounting to much more than just one or two BxU units. Also, what really separates one lens from another is not so much how sharp they each are in their respective "sweet spots" (the best-case combinations of aperture and focal length), but rather how well they maintain optimal or near-optimal performance across their focal length and aperture ranges.
Lets take a look at a case in point, comparing an economically-priced lens (the Nikkor 18-55mm f/3.5-f/5.6) to a relatively expensive, high-quality lens by the same manufacturer (the Nikkor 17-55mm f/2.8 constant aperture):
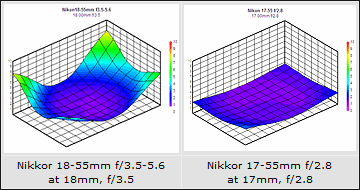
The worst case for most lenses is wide open, at maximum wide angle. This situation is shown above for the two lenses in question. In the case of the inexpensive lens, while it's actually very sharp in the center of the frame, note how dramatically the blur increases in the corners. This is very evident visually in photos shot with it at this combination of focal length and aperture. In contrast, observe how much more uniform the blur is in the case of the 17-55mm f/2.8 optic. There's a very slight rise in the plot along the left edge, and the corners are slightly softer than the center, but the average sharpness across the frame is significantly more uniform.
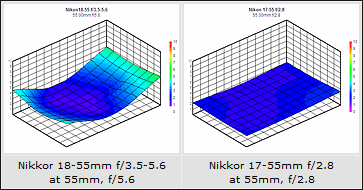
Here's another example, comparing these same two lenses. Again, the 18-55mm f/3.5-5.6 is on the left, the 17-55 f/2.8 is on the right. In these shots, we're looking at blur performance with each lens set to its maximum telephoto position of 55 mm, and again both are being shot wide open. Notice here how the 17-55mm's blur is uniformly low across the frame, while the 18-55mm has a pronounced "hill" on the right side of the frame.
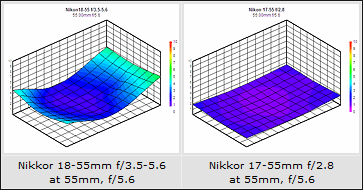
Also, consider that "wide open" for the two lenses at this focal length means f/2.8 for the 17-55mm, but only f/5.6 for the 18-55mm. To make the comparison a little more fair, take a look at the blur plot above for the 17-55mm at f/5.6. An aperture that's at the limit of the 18-55mm's performance curve is solidly within the "sweet spot" of the more expensive 17-55mm optic.
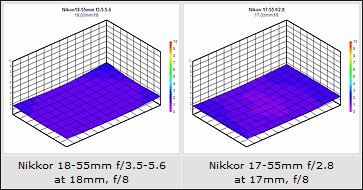
But lest one completely dismiss low-cost lenses out of hand, take a look at the two plots above. Here, we're again looking at the performance of the same two lenses at wide angle, but this time with both stopped down to f/8. When operating within its "sweet spot," we can see that the 18-55mm actually comes very, very close to the performance of the more costly 17-55mm, at least in terms of image sharpness. (Chromatic aberration might be another matter entirely, though.)
The examples above perfectly illustrate the sort of comparisons between lenses that our data allows. While absolute, numerical comparisons can't be made across different camera platforms, the overall behavior of lenses and their individual quirks and oddities are dramatically evident.
What our tests don't show
As powerful as DxO Analyzer is, it's very important to note that there are some critical aspects of lens performance that our testing doesn't reveal. (This is where the personal reviews contributed by our readers become particularly important.) Here are key issues that our testing doesn't address:
Far-field performance (Especially for wide-angle lenses)
Given the finite size of our studio and the targets available to us, the camera is always relatively close to the test target. (Especially with wide-angle lenses.) Good lenses generally behave similarly at medium and long focal distances, but "far field" performance could be different for some models. - Pay attention to the field report (when a lens review has one), as well as to reports and sample photos offered by other readers for this information.
Statistical quality-control information
At this point, we're only testing a single sample of each lens we review. Some unit to unit variation is possible, but we have no way of telling how much. It's possible that other samples of a lens may perform better or worse than the ones that we test. - Again, check the reader reviews for each lens, to see what the majority of readers' experience is like. (And be sure to share your own experiences with any lenses you own yourself.)
Long-term reliability
Our testing represents rigorous, but fairly limited use of each lens. We're generally dealing with either new lenses, or lenses borrowed from the manufacturer's consignment-loan pool, and only have each lens in our hands for a month or so at the most. This means that we have no way to evaluate the ruggedness or long-term reliability of the lenses we test. Build quality is one important reason why pro photographers pay premium prices for high-end glass. We can comment on apparent build quality, but the only real test will be how a lens performs over the long term, for a large number of users. Again, read the user reviews, and leave reports of your own experience wherever possible.