Image Stabilization Testing at The Imaging Resource
posted Sunday, January 4, 2009 at 4:52 PM EDT
Image stabilization is a hot feature in the world of photography, with multiple manufacturers offering a wide range of stabilization systems. Both lens-based and body-based (sensor shift) stabilization systems are available from a number of companies, with widely ranging claims as to their effectiveness.
The huge popularity of image stabilization lenses and bodies has led to the need for objective, quantitative measurement of the claimed performance, but to date there have been few, if any, truly objective reviews. Efforts thus far have either relied on subjective assessments of stabilization performance, or have revealed nothing of the protocols and methodology used to conduct the testing. We're not aware of any IS tests that have shown the variation in results experienced by different shooters. (Which we've found can be quite substantial.)
Chief lens test tech Jim Tanner and I have spent roughly the last 22 months studying how to best measure image stabilization performance, and have developed a protocol that we believe generates fair, accurate, and repeatable numbers describing IS performance that will be useful for comparing different image stabilization systems.
We believe that full disclosure of our testing and analysis methodology is essential if the results are to be trusted. We have prepared this white paper describing our IS testing methodology in complete detail. What follows is a careful and detailed description of our methodology that will help you understand how we arrive at our conclusions.
This paper is quite technical in its discussion, and includes fairly complicated mathematical and statistical methodology. Little effort has been made to simplify matters for non-technical readers. If you just want to know how to interpret the charts, graphs, and numbers we use to publish our IS test results, you may prefer to read our "How to Read our IS Test Results" article instead.
A brief summary of our findings
The following points are expressed in more detail in the body of the article, but we thought a concise summary at the beginning might save many less technical readers a lot of reading time.
-
IS performance is a very statistical phenomena: Expect a wide range of results from shot to shot
We suspect many photographers assume that IS systems will produce sharp images up to some arbitrary exposure length, and blurry ones past that point. In truth, whether you're using IS or not, you'll find at least some shots with shake-induced blur at surprisingly high shutter speeds, and an occasional sharp image even at very slow shutter speeds. What IS does is shift the range of generally sharp images toward slower shutter speeds. Don't expect 100 percent of your hand-held shots to suddenly turn out sharp, though. -
Performance of different systems varies widely
We expected to find a range of performance among IS systems, but were a little surprised at just how wide that range is. We measured IS performance ranging from zero stops (no detectable improvement at all) to about 3.5 stops. The conclusion: Just seeing the label "IS" (or VR, OS, VC, etc.) on a lens or camera body says little about how much it will improve your percentage of sharp shots. Objective testing of IS performance is clearly needed! -
Different shooters will often obtain very different results
We surmised that systems might perform differently for relatively shaky shooters than for ones who could already hold the camera very steady, and in fact found that to be true. What was interesting, though, was that sometimes the shaky shooter saw more benefit, while other times the more steady shooter saw the biggest improvement. For this reason, we always present results from both steady and shaky shooters, and provide a guideline to let each reader judge where their own camera-holding ability falls relative to our two testers. While our IS performance numbers provide a solid foundation for making relative comparisons between competing IS systems, it's clear that performance can vary as much between users as it can between systems. -
Your mileage may vary
This goes along with the point just made. Our IS performance numbers are very self-consistent, based on the people we have doing the testing. They provide a solid foundation for making relative comparisons between competing IS systems, but it's important to note that there is no internationally-accepted standard for characterizing IS performance. From our work, it's clear that performance can vary as much between users as it can between systems. It's thus entirely possible that you may experience results with any of these systems that are either better or worse than what we publish here. -
Manufacturers claims need to be taken with an appropriate grain of salt
We expect that various camera and lens manufacturers have their own internal methods for evaluating IS performance, that produce data supporting their claims of (for instance) "up to four stops of improvement." However, no standard for these claims applies between manufacturers, so there's no way that the numbers claimed by one company can be compared with those claimed by another. It's also not clear how performance "up to" a given level would play out in actual, real-world usage. Based as they are on measured shake-reduction performance as actually experienced by two very different photographers (representing something close to the two ends of the spectrum of camera-holding ability), we believe that our tests provide the basis for comparison that's been so badly needed, but which up until now has been completely absent from the marketplace. -
Almost all IS systems produce at least some benefit
Almost every stabilization system we've tested (about 25-30 lenses or camera bodies, as of this writing) showed at least some benefit relative to un-stabilized shooting. To date, there's been only one lens for which we found no benefit from its IS system; all the rest delivered useful levels of improvement in image sharpness for long exposures.
What is Image Stabilization and why do we need it?
Image stabilization systems were developed to overcome the blurry images that photographers get when shooting handheld at slow shutter speeds. This usually occurs in low light situations, such as indoors or at night. Long zoom lenses also amplify shaking in low light. Because most casual photographers do not want to use a tripod, getting good shots in low light requires some assistance from the camera.
In all of these image stabilization systems, a sensor measures camera motion, and some sort of moving element in turn works to counteract it, resulting in a stable (non-moving) image on the camera's sensor.
Image stabilization systems generally fall into two categories: lens-based and sensor-based. In lens-based systems, a small optical element internal to the lens can be moved to shift the image position at the focal plane. In sensor-based systems, the sensor itself moves to follow the shifting image rendered by the lens. Both approaches deliver similar results, but there are advantages to each.
Based on our testing to date, the current generation of lens-based image stabilization systems generally seem to provide greater motion compensation than do current sensor-based systems. Lens-based systems also have the advantage of steadying the image you see while framing your shot through the camera's optical viewfinder. Except in digital SLRs with Live View options, sensor-based IS systems can't do anything to stabilize the viewfinder image.
On the other hand, sensor-based stabilization systems have the huge advantage that they turn every lens you own into a stabilized optic: Since the stabilization is a function of the camera body, you gain its benefits regardless of what lens you happen to be shooting with.
If all you ever shoot are landscapes in full sunlight, you'll never see a need for image stabilization. If you're like the rest of us, though, any time you try to hand-hold your camera when shooting with available light (no flash) under dim conditions, you'll really appreciate what IS can do. As we'll discuss below, an IS system isn't a 100 percent guarantee against blurry photos, but it can shift the odds dramatically in your favor: Your percentage of hand-held "keepers" shot under low light will go way up.
Image Stabilization: How Good is Good?
Some image stabilization systems are going to work better than others. So what kind of measurement or performance indicator can we use to talk about them? Clearly better systems can compensate for more movement than lesser ones can, but how can we quantify this?
The easiest and most common way to talk about IS system performance is to do what the camera manufacturers do, which is to state it in terms of "stops of improvement." Arriving at a number of stops of improvement for a given system can be a tricky process, though, because there are so many variables. Think about it: As you gradually decrease shutter speed, you'll go from having all of your shots being sharp and blur-free to having only some sharp shots, to having only blurry shots. It's not a matter of there being a single shutter speed above which all your shots will be sharp, and below which all of them will be blurry. Rather, as you decrease the shutter speed, you'll pass through a range of speeds where the number of sharp vs blurry shots will decrease depending on how much the system has to compensate for your movement at the moment of capture.
There is a general rule of thumb in photography: to get a sharp image when shooting handheld, you should shoot at a shutter speed that's faster than one divided by the lens's focal length in mm. That is, for a 100mm lens, you should shoot at shutter speeds 1/100 second or greater. For a 300mm telephoto, shoot at speeds of 1/300 or higher.
Actually, the "1/[focal length]" rule is a pretty good one to follow if you're a reasonably steady shooter. A quick note for the digital era, though: You need to use the 35mm equivalent focal length, rather than the actual focal length of the lens when deciding what a "safe" shutter speed would be. So if you have a 200mm lens on a digital SLR with a 1.5x crop factor you should shoot at 1/(200 x 1.5) or 1/300 second or faster.
So let's say that you have a 100mm-equivalent lens and find that, if you're careful, roughly 80 percent of your shots end up sharp at a 1/100 second shutter time. Now, suppose you put that same lens on a camera body with built-in (sensor-based) image stabilization. If it's a good system, you may find that now you can drop the shutter speed to 1/25 second, while still having roughly the same 80 percent of your shots come out sharp. That's a decrease in shutter speed of a factor of four, the equivalent of two f-stops of exposure increase. (Each "stop" corresponds to a factor of two greater or lesser exposure.) The camera's IS system could thus be said to have an effectiveness rating of two f-stops. If the camera only let you cut the shutter speed in half (to 1/50 second), it could be said to have a 1-stop IS rating. F-stops of improvement is how most manufacturers describe the performance of their IS systems.
In our testing to date, we've found that the performance of most sensor-based IS systems is in the range of 1.5 to 2.5 stops of shake reduction. Lens-based systems range from under 2 stops to as high as 3.5 stops. Manufacturers claim figures of merit of 4 stops or greater, but our actual measurements have shown performance topping out somewhere around 3.5 stops. The obvious next question is: How do we go about determining how many stops of improvement an IS system gives?
How can you determine an IS system's effectiveness?
On the face of it, measuring the performance of an image stabilization system would seem to be pretty straightforward: Just shoot a lot of photos over a range of shutter speeds with and without the IS enabled, and see how many more sharp photos you get with it on than with it off. According to conventional thinking, there'll typically be a shutter speed below which shake-induced blur gets noticeably worse. The figure of merit for an IS system would them be how much that characteristic shutter speed was reduced when the IS system was activated. Unfortunately, as mentioned above, the transition from blur-free to blurred shots doesn't happen abruptly, at a single shutter speed.
So how can we go about measuring IS effectiveness? There are three factors to consider, and, we've discovered, a lot of attention required to develop a consistent methodology. As we'll see, too, IS effectiveness can depend quite a bit on the individual photographer: Some shooters will see more improvement from a given IS system than others would.
Blur Measurement
If the aim is to reduce shake-induced blur, then surely the most basic requirement is to be able to characterize blur precisely. First and foremost, we need an accurate, reliable, and repeatable way of measuring the amount of blur in a photograph. If we can't do this, we won't be able to tell whether we're really comparing apples to apples when deciding how sharp or blurry images are with IS on or off. Simply judging images by eye isn't good enough for a truly quantitative evaluation: Some genuinely quantitative measurement is necessary, if the results are to be numerically valid, objective, and consistent.
Statistics
As we noted above, an IS system doesn't guarantee sharp images for all shutter speeds faster than some arbitrary limit. Rather, it reduces the effect of camera shake by compensating for it. From shot to shot, the amount of movement your camera is experiencing at the precise moment of exposure actually varies quite a bit. Sometimes the camera will be moving a lot, at other times it will be surprisingly stable, if only for a moment.
It might be possible to design some sort of shaker table that mimics the behavior of typical camera users. We suspect many camera and lens manufacturers have done just this. It's far from a trivial engineering problem, as the shake-simulating device has to reproduce both translational and rotational vibration. A simple shaker table that just moves up/down or side to side would miss many important vibrational modes. Short of this, the only alternative is to capture a number of photos at various shutter speeds, and look at the average results. Two valid questions are how many shots are needed, and what constitutes average behavior for the photographer.
Different photographers
This naturally brings us to the question of how much the photographer affects the outcome. Do image stabilization systems work better for relatively shaky photographers, or do they do better for ones who are already fairly stable? Or do they treat both equally?
Quantitative blur measurement: DxO Analyzer
What actually led us to think about IS testing in the first place was the realization that we already had an excellent (quantitative, precise, and repeatable) way to measure the blur present in images: DxO Analyzer. This is the primary software we use in our lens testing at Imaging Resource. It is a highly automated solution for performing myriad optical measurements. DxO Analyzer measures blur in what DxO calls "BxU" or "Blur Experience Units." A lot of deep mathematics boils down to the fact that BxUs correlate very well with human perception of "sharpness" in images. Our own use of DxO Analyzer in lens testing has convinced us that its BxU measurements are very repeatable, and do indeed correlate well with our own perceptions of what's sharp and what's not. Relative to our own perceptions, BxUs also seem to represent a reasonably linear scale, in that an image with a blur value of 3.0 looks roughly twice as blurry as one with a blur value of 1.5.
In our view, a quantifiable, repeatable method of measuring blur is fundamental to the evaluation of image stabilization performance. Human judging of blurred images is an inherently subjective process, and even in the case of a single judge (eliminating problems of variation between judges), is subject to wide variation from trial to trial. The psychological effect of things such as recent visual experience and rest/fatigue levels on human visual perception are well-documented, to the point that any reliance on human visual judgement for quantitative results is potentially fraught with error. Even if all you're doing is assigning images to fairly broad categories (e.g.: sharp, almost sharp, slightly blurred, very blurred), images that are on the borderline between categories are highly subject to incorrect assignment. Thus, only objective, deterministic blur measurement methods should be accepted for critical evaluations: If you can't measure blur objectively and deterministically, you can't claim to be conducting objective IS performance measurements. DxO Analyzer provides just the sort of quantitative and repeatable blur measurement that's needed.
Normalization: Motion blur vs Focus blur
In its intended usage, DxO Analyzer measures blur caused by optical limitations and defects by analyzing an array of dots across the image area. This sort of blur is generally pretty uniform, producing only relatively minor changes in the shapes of the target dots themselves, resulting from geometric distortion in the optics, or from coma distortion along the edges or in the corners of the frame. This blur is rather different from the blur that is produced by motion of the camera/lens system during the exposure, and it turned out that the BxU measurements produced by DxO needed to be normalized to translate them into accurate representations of blur resulting from camera motion.
We discovered that the BxU values produced by DxO Analyzer became disproportionately larger, the more motion occurred during the exposure. For relatively small amounts of motion blur, the BxU numbers correlated very well with the visual appearance of the target dots in the captured images. When the images of the dots became noticeably elongated, though, the calculated BxU values increased faster than did the apparent blurring of the dots.
This disproportionate increase in BxU values for large amounts of motion blur significantly distorted the performance curves we tried to fit to the raw test data. (Much more on this curve-fitting process below, in the section titled "Describing the data: What curve to fit?") In order to accurately model the way blur increased with exposure time, we needed blur data that accurately reflected the distance the target image shifted on the focal plane during the exposure.
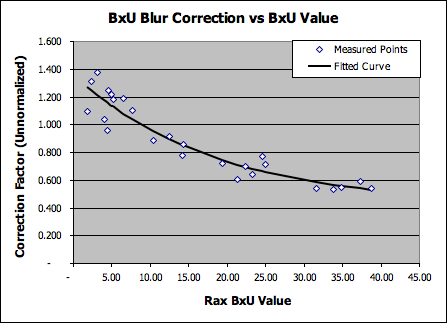
To develop this normalization, we manually measured the elongation of a large number of target dots in the test images for a wide range of BxU values, and compared that elongation (a very direct measure of motion-induced blur) with the BxU values themselves. When we graphed the results, we found a very clear and consistent correlation between BxU values and the amount of linear blurring on the focal plane. The graph that resulted (shown above) showed a beautiful decaying-exponential behavior, one that we could fit a function of the form Y = A + B(-Cx) to very cleanly. This translation of BxU units into units measuring relative displacement of the subject image on the focal plane dramatically improved our ability to model IS system performance.
Statistics: Stabilization is a moving target
We wince when we see sample photos purporting to show the effectiveness of image stabilization systems based on a single pair of "typical" images. Our own testing has shown us that the variation from shot to shot can often be greater than the average variation with IS on vs IS off. The only situation in which single-shot IS comparisons can be considered remotely meaningful is if the two camera systems being compared were bolted together (so each would be experiencing identical movement) and the shutters were tripped at exactly the same instant. (We actually did this at IR during the early days of IS technology on digicams, although we never made it a part of our standard test procedure.)
Even if competing IS systems were compared shot-by-shot under identical conditions, it obviously takes more than one shot to show how the systems perform. A significant failure mode of IS systems occurs when the moving optical element reaches the limit of its range of movement while trying to compensate for the movement of the camera/lens system. In mathematical terms, it's a "random walk" sort of problem in a chaotic system. Even with two identical systems bolted together and experiencing identical camera motion, the chaotic nature of the problem makes it almost certain that one system will bump up against its motion limits before the other does. -- And on the next shot, the situation might well be reversed.
So the only way to accurately measure IS performance is statistically, by looking at results taken from a set number of shots.
The question then becomes how many runs or data samples are sufficient to get a sense for how the IS systems are performing? This an area where the law of diminishing returns comes into play. While it might be desirable to look at a thousand shots at each shutter speed, that obviously wouldn't be very practical.
Our protocols evolved as we developed our test methodology. Initially, we found that we could get pretty good statistics by capturing 10 frames at each shutter speed, both with IS on and ISO off, incrementing the shutter speeds by a full f-stop (factor of two) between sets of shots. As our testing evolved, we found that we could significantly improve the statistics and increase the repeatability by collecting data at more shutter speeds (stepping by 1/3 stop increments), but with fewer data points at each speed (as few as 5 frames at each speed). Using shutter speeds separated by a full f-stop, the statistics didn't seem to tighten appreciably as we went from 10 to 40 shots for each case. By contrast, when we dropped to 1/3 EV steps in the shutter speed, the repeatability of our curve fits and measures of performance with only five shots per step was better than the fits we got with full-EV shutter speed steps, regardless of the number of trials. Currently, we generally run a full series of 5 shots per shutter speed, and then go back and shoot up to 10 additional shots for shutter speeds in the "transition region," the range of speeds over which blur increases from very low values to those too high to result in usable photographs. (We discuss more about this transition region, and how it plays into our data analysis further below.)
Some of the data we'll be publishing in the weeks and months to come (this is being written in early April, 2009) will be from our earlier trials with full-EV shutter speed steps, while other results will be from tests with our latest methodology. The main difference between the two protocols is that the earlier full-step approach gave a confidence interval of about +/- 0.5 stops in our measurements of IS performance, whereas the 1/3-step approach consistently repeats to within 0.2-0.3 stops. We'll identify the protocol used for each test we publish, so you'll be able to weight the conclusions appropriately. Given the amount of time these tests require, it'll be quite some time before we run out of new IS lenses and bodies to test, but over time, we'll try to work in re-tests of some of the systems originally evaluated with the full-step protocol.
Different strokes: How much does the photographer matter?
One question we had early on was what effect the photographer had on the effectiveness of an IS system. Given how much the ability to hold a camera steady varies from person to person, it seemed likely that we would see rather different levels of IS effectiveness between different shooters. This in fact proved to be the case.
To investigate this, we ran a series of tests with five of us at Imaging Resource headquarters. While only five individuals were involved, the amount of camera shake varied quite widely between them, from very steady shooters (e.g., able to routinely get sharp photos at well below the 1/focal length rule of thumb) to very unsteady (only able to get sharp photos well above the 1/focal length rule most of the time): We think the camera-holding abilities of these five test subjects cover those of a large percentage of the photographic community.
What we found was perhaps no surprise: Different shooters do indeed seem to get varying levels of benefit from IS systems. Most of the time, the steadier the shooter, the more benefit he saw from the IS system. (We're not being sexist in our pronouns here; all our test shooters happened to be male.) Our "steady" shooter often sees greater improvements in shake-induced blur than does our "shaky" shooter. But this isn't always the case, and sometimes the shaky shooter saw significantly more improvement. Reassuringly, with our 1/3-stop test protocol, we found very consistent performance numbers for the IS systems when we tested the same system with the same shooter multiple times across a period of weeks.
It's a little ironic that it's the steadier shooters who frequently appear to benefit most from IS systems, when it's the shakier shooters who need them the most. The good news, though, is that almost all of the systems we've tested to date (upwards of 25 or so, as of this writing) produced useful reductions in shake-induced blur, regardless of who was using them. In our test results for IS systems, we'll show data from both "shaky" and "steady" users, so you'll have some idea of what to expect from lenses and camera bodies depending on the type of shooter you are.
How do you know whether you fall into either the "steady" or "shaky" category? As we mentioned earlier, the rule of thumb for the slowest shutter speed that can be reliably hand-held has always been one divided by the focal length. (1/200 second for a 200mm equivalent focal length, 1/50 second for a 50mm equivalent, etc.) Compare yourself to that guideline: For some particular focal length, preferably toward the telephoto side of things, shoot a number of photos at a range of shutter speeds, ranging from faster to slower than the 1/focal length guideline. Snap at least 4 or 5 shots at each shutter speed, so you'll have some idea of what your average performance is.
Now, if you find that you tend to get blurry photos at shutter speeds a half- to full-stop or more faster than the guideline speed, put yourself in the "shaky" category. On the other hand, if you find that you can get a good percentage of sharp shots a half- to a full-stop slower than the guideline speed, you're well into the "steady" category. If you're somewhere in between, your results with the IS systems we test will probably lie somewhere in between those from our "shaky" and "steady" shooters.
Methodology: Controlling Focus
As we discuss elsewhere we've found that variations in autofocus performance can significantly mask or distort lens performance measurements. The same proved to be true in our evaluation of IS systems: While some camera/lens systems were able to deliver consistent data when using the camera's AF system, a few AF systems introduced significant variation into the raw blur data.
Our solution for dealing with this has varied somewhat, depending on the lens/camera system being tested. Sometimes, we can use the focus-bracketing technique described in our Fallibility of Focus article: Before a test run, we prefocus the lens and determine the actual point of optimal focus, using our mobile optical-rail system. During the IS test runs, the lens is left in manual focus mode, and the test subject positions himself to maintain the optimal lens-subject distance as found on the rail test, guided by a laser alignment tool. In cases where the camera involved has difficulty focusing on the repeating-dots pattern used for the DxO analysis, this approach dramatically reduces noise in the blur data and improves the repeatability of our IS testing.
Unfortunately, some IS lenses perturb the focus setting whenever camera power is toggled (as in removing the memory card to check results), even in manual focus mode. In these situations, we have to rely on camera AF, but have found that careful choice of focus protocol, coupled with use of smaller aperture settings can deliver good data despite minor errors in the camera's AF system. We've also added a small "x" mark to the center of the DxO test target, to help cameras that have a hard time with the repeating-dots target pattern. We've found that this tiny focus-assist mark has virtually no impact on the raw BxU numbers, but does seem to help some camera's AF systems quite a bit.
Image Stabilization: Effect of Focal Length
Just as we expected to find variation in IS effectiveness with different photographers, we also expected to see differences as a function of focal length. At shorter focal lengths, less correction is needed for a given amount of camera movement, while at longer focal lengths, the same camera movement will produce a much greater displacement of the image on the imaging sensor's surface. This might lead you to think that IS systems would invariably be more effective at shorter focal lengths, but in practice, that's generally not the case. Of course, you also need less help at shorter focal lengths, for the very reason that shake produces less blur there.
Accordingly, when we test an image-stabilized zoom lens, we test at both ends of the lens' range. For body-based IS systems, we routinely test at roughly 70 and 200mm focal lengths, to see how the system behaves, and to facilitate comparison to common lens-based IS systems.
Image Stabilization: Effect of Aperture and ISO, and the Need for Normalization
To properly test an IS system, we need to capture test images across a very wide range of shutter speeds, to ensure that we're covering the full span of performance. On the one hand, we need to capture shots at high enough shutter speeds that camera shake is having negligible impact on image sharpness with the IS system turned off (to be safe, typically 2 stops faster than the 1/focal length rule). At the other extreme, we have to capture samples at shutter speeds slow enough that the IS system is entirely unable to cope with them, which can be as much as 5 stops below the 1/focal length rule for a top-performing lens-based IS system. We thus typically need to shoot across a range of up to 7 stops of exposure time. For instance, testing a 200mm IS lens, we may want to shoot as fast as 1/800 second on the high side (two stops beyond the 1/focal length rule) to as slow as 1/6 second on the slow side (5 stops below the 1/focal length rule).
The need to span such a wide range of shutter speeds means we often need to shoot at apertures ranging from wide open to fairly small, as well as at a range of ISO settings. While we can adjust our target lighting across a fairly wide range, getting enough light on the target to handle the highest shutter speeds called for on a lens in which we're also having to stop down somewhat to negate focus errors can be a little challenging, and require the use of higher ISO values.
Because lens sharpness varies as a function of the aperture, and the camera's recorded sharpness also tends to vary somewhat as a function of ISO, it's important that we reference all our measured sharpness values to a baseline. Essentially, what we need to do is to compare the sharpness we're measuring for each shutter speed and set of conditions with the results obtained under the same conditions, but with the camera mounted on a tripod. This lets us accurately separate the increase in blur numbers resulting from camera shake from any changes in sharpness that might be caused by other factors. More about this a bit further below.
Image Stabilization Test Methodology: The Bottom Line
The bottom line on all of the above is that, after well over a year of development, we're comfortable that our test methodology for evaluating image stabilization systems represents best practices; using objective, quantitative, deterministic blur measurements, providing an adequate statistical basis, eliminating AF performance as an error source, and providing for possible user-related performance differences. Over the many months that we've spent developing and refining this protocol, we've seen very repeatable test results and both statistical and single-number performance indicators that parallel results from actual usage very well.
Presenting the Results: Statistics versus Single Numbers
We wrestled a fair bit with how best to present the results of our image stabilization testing. As we've noted, blur from camera shake is very statistical: Across a fairly broad range of shutter speeds, the average user will end up with both sharp and blurred images to varying degrees. To help our readers get a sense of how image stabilization will actually work in practice, we wanted to be able to convey a sense of this shot-to-shot variability. For the sake of comparing IS systems to each other, though, we also wanted to be able to boil the test results down to a single performance number, for any combination of focal length and photographer.
As we explored different ways of presenting our data, we quickly discovered that it would be easy to absolutely inundate the reader with graphs and charts, so we needed to exercise considerable editorial judgement in deciding what to show and how to show it.
Initially, we were drawn to a stacked bar-graph format that we used in some of our early efforts at IS testing, with digicams. (See example below.)
A graph of this sort is nice because it gives readers a pretty good idea of the percentage of good vs bad shots they might expect with a given IS system at a particular focal length. There are two problems with this sort of display, though. First, our criteria for "good" or "acceptable" may not agree with yours. (And yours may well vary depending on the type of shot and its intended usage.) Minor changes in the criteria for each threshold could result in significant changes in the appearance of the graph. Second, it's a rather large plot, and only shows data for a single test run: With most zoom lenses, we test with IS on and off, at both ends of the zoom range, and with two different shooters. That'd be 6 separate graphs, just to describe one lens. And this isn't the only graph we'd need, because it doesn't support quantitative measurements of improvement from IS on to IS off. We thus, somewhat reluctantly, gave up on the stacked bar graph as a display format.
Instead, we settled on the much more concise format shown below, which plots the actual blur values for every shot we captured, as well as curves fitted to the data, from which we can measure the amount of shake reduction. An example is below.
The image above shows all the data collected for a test with the Canon 70-200mm f/4L IS lens, at a focal length of 70mm, captured by our "shaky" shooter. Each point corresponds to the DxO blur value at the center of the frame for a particular shot. The horizontal position shows shutter speed (in this case, in 1/3-stop increments, while the vertical position shows the blur rating (BxU) for that shot, relative to the average value obtained using the same exposure parameters and the camera mounted on a tripod. All values shown are the result of having subtracted the "tripod" values for that shutter speed: Hence, scatter in the data results in some individual values being slightly less than zero.
As a guide to interpreting the data in this graph, we also provide a color-coded version (shown above) that you can see by hovering your cursor over the (previous) graph. The coloring on the graph represents ranges that correspond to acceptably sharp images (green), marginally sharp ones (yellow) and unusable shots (red). By looking at the relative proportion of shots falling within the green band, you can get a rough idea of how many shots were acceptably sharp at that shutter speed. We deliberately didn't present the sharp/blurred performance threshold as a specific ratio of good to bad shots at each shutter speed, for two reasons. First, as mentioned earlier, what constitutes "acceptable" blur may vary quite a lot, depending on the photographer, the subject, the lens in use, and the use that will be made of the photos. For example, one full blur unit above the tripod value is noticeably soft, and may be too much in some situations; it may also be perfectly fine for others. The second issue is that, in most of our tests, the actual number of shots at each individual shutter speed may be relatively small; as few as five in many cases. (What makes the statistics work for fitting the performance curve is the large number of shots, spread over a wide range of shutter speeds, versus a large number at any single speed.) With such a small number of shots at a given shutter speed, it would be misleading to say with any claim to definitiveness that, for example, "60 percent of shots were sharp."
For reference, we've also drawn-in a line showing the shutter speed corresponding to the inverse of the effective focal length. In the case above (with the lens attached to a Canon body with a 1.6x crop factor), this corresponds to 1/(1.6 x 70) = 1/112 second. This is the shutter speed that has traditionally been considered to be the lower limit for hand-holding a shot.
The plot above gives a good general idea of how the IS system performed over a range of shutter speeds, relative to how the human holding the camera/lens did without the benefit of image stabilization. For photographic purposes, though, only the lower reaches of the graph are actually interesting. Thus, when we're discussing the performance improvement of a given lens, you'll see a graph like the one below:
Here, we're looking at just the part of the graph showing incremental blur values of 0 to 4 units above the baseline established by the tripod. The arrows in the plot indicate the horizontal separation between the two blur curves (IS on versus IS off) at thresholds for shake-induced blur of 0.5 and 1.0 BxU units above the high-shutter-speed baseline. The horizontal separation between the two curves is a measure of the performance of the IS system for that particular combination of camera, lens, focal length, and photographer: It shows the difference in shutter speed between the point at which blur became unacceptable when hand-holding the camera with IS off vs the shutter speed where it became unacceptable with the IS system turned on. In the illustration above, the IS system delivered about 2.3 stops of improvement for our "steady" shooter, regardless of whether we specified a threshold of acceptable incremental blur of 0.5 or 1.0 units. (See the discussion of this under the heading "Calculating the Improvement: What Threshold to Use?" below.)
In these more zoomed-in curves, we've zeroed-out the offset in both curves, to assist in their interpretation. The offset of the curves isn't significant in our calculations of IS performance, because the cutoff threshold for both the IS on and IS off conditions is always calculated relative to each curve's individual baseline. Shifting the curves to a common baseline of zero makes it easier to see the horizontal separation between them. For the sake of visual clarity, we don't show the individual data points by default, but if you mouse over this graph, you'll again see both the data points and the color-coding that appears on the larger graph in response to a mouse-over as well. The version of this graph showing the points and color-coding also shows the baseline offset in the curves, so you can better see how the curves fit the individual data points.
Next, since so much hinges on it, let's take a look at exactly how the blur vs shutter speed curves are arrived at, and how the separation between them is measured.
Boiling it Down: How Many Stops of Improvement?
As we've discussed above, the bottom line for any image stabilization system is how much slower a shutter speed it will let you use and still get sharp images. Given the increasing random variation in blur numbers as shutter speeds decrease, though, how can we accurately characterize the average improvement? In other words, how can we boil down the blur results from hundreds of individual shots captured across a wide range of shutter speeds, to come up with a single number that represents the average (or "expected value") of blur at any given shutter speed?
What we're really talking about doing here is finding mathematical functions that describe the shake-vs-shutter speed relationship for both the IS on and IS off conditions, and then using those functions to determine the amount of improvement at a given threshold of acceptable blur. This process of matching a mathematical function to experimental data is quite common in experimental science, and is generally referred to as curve-fitting.
Describing the data: What curve to fit?
As its name suggests, the general idea with curve-fitting is to find a smoothly-varying function that best fits all of the available data points. This doesn't necessarily mean a curve that passes through all the data points, but rather one that gives the best approximation to the true relationship, across all points in the data set. It's actually fairly rare that a fitted curve will pass directly through even a few of the raw data points: The idea is to minimize the distance from each data point to the curve you're drawing, and then minimize the sum of those distances for all the data points taken together.
The mathematical technique used to do this is called the least-squares method. Before you can perform a least-squares fit though, you need to have some idea of the sort of function that best describes the data. Most commonly, least-squares fits assume a polynomial function, of the form y = a + bx + cx2 + dx3 [...] This works reasonably well to fit a smooth curve to an arbitrary set of data points, but doesn't work if the underlying physical phenomena is fundamentally nonlinear. In the case of our blur vs shutter speed data, polynomial fits proved to be of essentially no value.
To those familiar with mathematical functions, the general shape of the blur vs exposure time curves will immediately suggest a power law relationship. That is, an equation of the general form y = a + bxn, where a, b, and n are the variables to be solved for. In our case, we represent the successive full-stop increases in exposure time as unit increases in a variable "K", which we use as our "x" when fitting the power-law equation. Once we've solved the equation, we translate the K-value back to a corresponding physical shutter speed. This neatly deals with the logarithmic shutter-speed scale, and makes the fitting much more tractable. We also employ an offset in the k-value that's varied by the least-squares fitting, so the ultimate equation we're fitting looks like y = a + b(k - K0)n. The offset in K lets the equation fit the actual shape of the data more closely.
A power-law equation like this is a bit messier to do least-squares fits to than would be a polynomial function, as the only way to solve for the exponent n is by successive approximation or linear programming: It can't be calculated explicitly. It becomes fairly straightforward when calculated with a computer, though.
Three regimes of behavior
In practice, we found that we obtained the most consistent results by dividing the data points into three regions or regimes of behavior, and then treating the three regimes separately in our curve-fitting. At high shutter speeds, we calculate the baseline value as the simple average of all the points at speeds lower than that at which the values first began rising from the baseline. As shutter speeds become lower, the average values of the data points begin to rise from the baseline. This is the most photographically relevant area, because it's the region where the average image begins to include some shake-induced blur, but where many images are still usable. Over this region, we fitted the power-law equation described above, to model the increase of blur with shutter speed. Finally, beyond a certain point, the blur is so high that it's no longer photographically relevant (the vast majority of shots are so badly blurred that they're essentially useless). We called this the "chaos region," and excluded it from our curve-fitting because it (a) wasn't photographically relevant, and (b) the relationship between measured blur values and shutter speed loses coherence there.
Working with data from dozens of test runs, we've found that our approach produces very good fits to the data through the all-important transition region (the photographically interesting area where you progress from mostly sharp to mostly blurry shots), and excellent repeatability between runs. That is, we can take the same lens or camera body, shoot it using the same photographers on different days, process each set of data without reference to earlier or later data sets, and arrive at very similar numbers for IS improvement: In the case of our third-stop testing protocol, the data repeats to within a range of plus/minus 0.1 to 0.3 stops, the average repeatability being somewhere on the order of 0.2 to 0.3 stops.
Calculating the Improvement: What threshold to use?
We define the performance of an IS system for a particular user as the difference between the shutter speeds at which the average blur just verges on being unacceptable in the IS-off and IS-on cases.
The key question then becomes: "What should we consider to be the threshold for just-acceptable blur?" The answer to this question will obviously vary significantly from photographer to photographer and, perhaps even more so, with the use to which the photos in question will be put. Also, with a very sharp lens, an increase of only a half a blur unit would be quite visible, but with a lens that's already somewhat soft, an increase of a full blur unit might not be all that prominent, particularly for images printed at smaller sizes (as you'd be more likely to do with a softer lens).
Given this range of variation, we decided to measure and report on stabilization performance using two different thresholds: A threshold of 0.5 blur unit that might be appropriate for sharp lenses and relatively large print sizes, and a threshold of 1.0 blur unit that would match the needs of photographers shooting with softer lenses and printing smaller. The chart below shows how these two different thresholds affected our measurements for the Canon 70-200mm f/4L lens, as shot by our "shaky" shooter at 200mm:
This particular graph illustrates a somewhat counterintuitive result that we occasionally encounter: If we choose a less stringent blur threshold, the measured shake reduction of the lens actually decreases. This is contrary to what most people would expect, but in fact makes perfect sense when you look at what's happening. The results do show that relaxing our criteria for acceptable blur lets us shoot at slower shutter speeds, which is exactly what you'd expect. The reason the measured blur reduction decreases is that the blur curve for the IS-on case turn up more quickly (blur increases more rapidly with longer shutter times) than it does for the IS-off case. The IS system still helps a great deal relative to what the photographer can achieve on his/her own, it's just that when it finally reaches the limit of its ability to compensate for the camera shake, it loses control a little more rapidly than did the photographer himself. The difference between the two thresholds is relatively minor, but we show results from both, so you can get an idea of not only the amount of relative improvement achieved, but also of the actual limits in terms of how slow a shutter speed you could expect to get away with in actual use.
The ability to see this sort of detail in systems' IS performance demonstrates the value of the detailed analysis and modeling we've developed for studying these systems: Users can develop a much better sense of how a given IS system will perform, based on their own abilities (shaky versus steady camera holding) as well as on their intended use of the photos (large or small print/display sizes).
The Last Step: Actually Calculating the Improvement
The beauty of reducing all the blur data to a power-law equation is that we can then solve exactly for the IS improvement at any given blur threshold, measuring exactly the separation between the IS-On and IS-Off performance curves. Basically, with an equation of the form y = a + bxn, we can simply set a=0, and then solve for the x value that gives a y-value equal to the blur threshold we're interested in (0.5 or 1.0). Do this for the IS-On and IS-Off cases, subtract the difference in x-values, and you've got the improvement in f-stops for the system being tested.
Conclusion
For those of you who've made it this far, congratulations! This was some pretty heavy sledding, a lot more technical than 99 percent (99.99 percent?) of our readers probably care to think about or deal with. As we said at the outset, though, the degree of trust one can place in the results of any testing is directly a function of how much one understands and trusts the test methods employed. Test results provided without a thorough explanation of the methodology used to develop them are quite literally meaningless. The Imaging Resource has always maintained a high standard in openness regarding our test procedures and methodologies, and we felt we could do no less here. Even if most readers will never delve this deeply into the why and how of our IS testing, the fact that the information is here for all to see and comment on means the results can be trusted. (Or, if you disagree with our methods, you'll at least have the information at your disposal to make that judgement, and know in what way you should discount them.)