Sony A200 Imatest Results
We routinely use Norman Koren's excellent "Imatest" analysis program for quantitative, thoroughly objective analysis of digicam test images. I highly recommend it to our technically-oriented readers, as it's far and away the best, most comprehensive analysis program I've found to date.
My comments below are just brief observations of what we see in the Imatest results. A full discussion of all the data Imatest produces is really beyond the scope of this review: Visit the Imatest web site for a full discussion of what the program measures, how it performs its computations, and how to interpret its output.
Here's some of the results produced by Imatest for the Sony A200:
sRGB Accuracy Comparison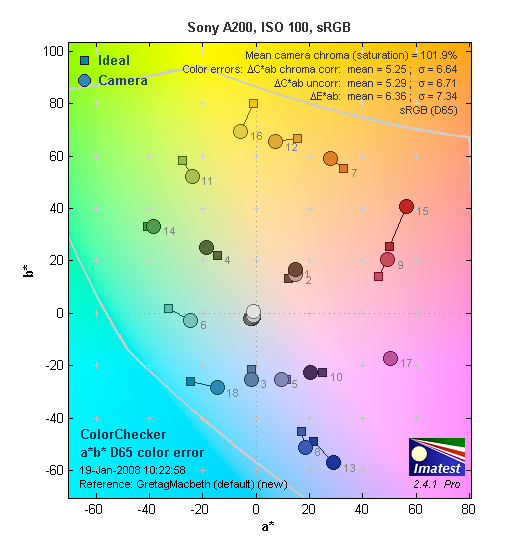 |
|||
The Sony A200 showed very good color accuracy, as well as fairly accurate saturation levels. Hue accuracy was quite good, with most of the hue shift occurring in the cyans, blues and reds. Average saturation was 101.9% (only 1.9% oversaturated). Average "delta-C" color error was only 5.25 after correction for saturation, which is also very good. (Delta-C is the same as the more commonly referred to delta-E, but delta-C takes into account only color differences, ignoring luminance variation.) Overall, a very good color response for an SLR, especially a consumer oriented model. Mouse over the links below the illustration above to compare results with competing models.
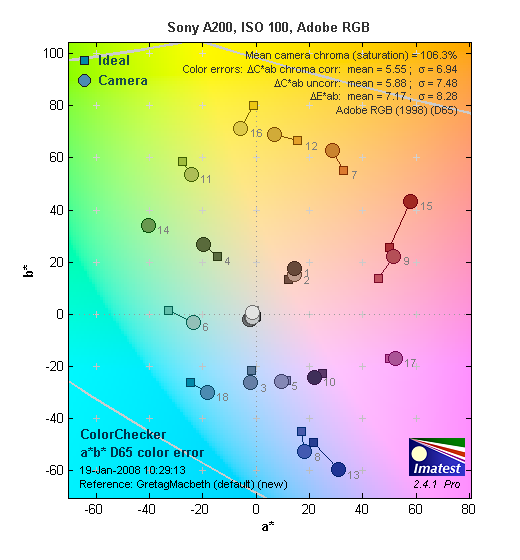
Using the Adobe RGB color space (which provides a much wider gamut, or range of colors that can be expressed), the Sony A200 delivers more highly saturated color, with an average saturation-corrected hue error of 5.55 "delta-C" units, and average saturation of 106.3%. Again, mouse over the links below the illustration above to compare results with competing models (sorry, no Adobe color error results from Nikon D40x or Olympus E-510).
Sony A200 Color Analysis
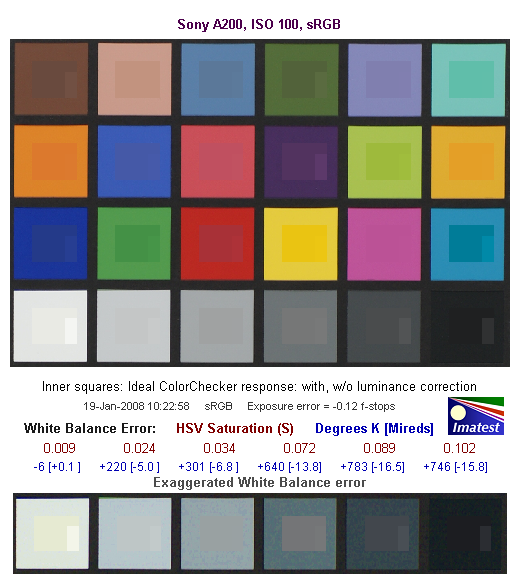
This image shows how the Sony A200 actually rendered the colors of the MacBeth chart, compared to a numerically ideal treatment. In each color swatch, the outer perimeter shows the color as actually captured by the camera, the inner square shows the numerically ideal color, after correcting for the luminance of the photographed chart (as determined by a second-order curve fit to the values of the gray swatches), and the small rectangle inside the inner square shows the numerically ideal color, without any luminance correction. This image shows the very good hue accuracy, as well as a contrast curve that results in slight overexposure of some of the highest-saturation swatches. Overall though, the colors are impressively close to their "correct" values.
Sony A200 Noise Analysis
There's a lot in this particular graph, a lot more than we have room to go into here. (This set of plots has also changed a little in the more recent versions of Imatest. Some of the plots that were shown here previously are now shown in other Imatest output. Since we largely focus on the Noise Spectrum plot, we'll only show the graphic above, which includes that plot.)
In comparing these graphs with those from competing cameras, I've found that the Noise Spectrum graph at lower right is the most important. Cameras that manage to shift their noise spectrum to higher frequencies have much finer-grained noise structures, making their noise less visually objectionable. In the graph above, this would show up as a noise spectrum curve that remained higher on the right side, representing higher noise frequencies. The champion at this was the Canon EOS-1Ds Mark II, which produced remarkably fine-grained image noise, even at very high ISOs.
The Sony A200 does a pretty good job of keeping plenty of the noise energy at high frequencies; what little low-ISO image noise that's there is more fine-grained as a result. What's a little odd here though, are the spikes that occur in the Noise Spectrum plot every 0.125 or 1/8 cycles per pixel. The source of the noise spikes appears to be the lighter pixels along the edges of the 8x8 pixel blocks used in the A200's JPEG encoding. To illustrate, below are modified crops from the Sony A200 (left) and Nikon D40x (right). After cranking up the contrast and magnifying by 200% (overall, a pretty significant manipulation, these artifacts aren't nearly as visible in the unaltered image), the abrupt edges of the 8x8 blocks in the A200 crop can be easily seen. Block edges cannot be seen in the Nikon D40x crop, nor can they been seen in converted A200 RAW files. What's even odder though, is that normal compression reduces the size of the spikes, compared to fine. (Do I smell a firmware update coming?) This might be an issue, but the overall noise levels are so low that the noise spikes aren't really visible at ISO 100 under normal conditions. Bottom line, the Sony A200 noise levels are low at low ISO, with a frequency spectrum that has more energy on the higher frequency (right-hand) side of the curve than do many cameras.
|
Middle gray patch, very high contrast, magnified 200%
|
|
 |  |
|
Sony A200
|
Nikon D40x
|
Here's the same set of noise data at ISO 3,200. Here we can see there is a dramatic shift towards the left of the graph (particularly in the red channel), indicating much courser grain structure to the noise. And indeed, when ISO 3,200 images from the A200 are closely examined, this effect can be easily seen.
This chart compares the Sony A200's noise performance over a range of ISOs against that of other cameras. While I continue to show noise plots of this sort because readers ask for them, I each time point out that the noise magnitude is only a small part of the story, the grain pattern being much more important. Here, we can see that the Sony A200's luminance noise starts out quite low, comparable to most of the competition, then rises at roughly the same rate as the others to ISO 400. It continues to rise to ISO 800, where most of the competition's high ISO NR has already kicked in. (Decreasing noise levels, but at the expense of some fine detail.) Then we see A200 noise levels drop dramatically at ISO 1600, where its more aggressive high ISO NR kicks in. It then rises again, ending up at level much lower than the D40x, the only other camera in this group that has an ISO 3,200 setting. Keep in mind these measurements are at default noise reduction settings, so the shape or position of the curve could be influenced by the settings you choose to use.
Sony A200 Dynamic Range Analysis
A key parameter in a digital camera is its Dynamic Range, the range of brightness that can be faithfully recorded. At the upper end of the tonal scale, dynamic range is dictated by the point at which the RGB data "saturates" at values of 255, 255, 255. At the lower end of the tonal scale, dynamic range is determined by the point at which there ceases to be any useful difference between adjacent tonal steps. Note the use of the qualifier "useful" in there: While it's tempting to evaluate dynamic range as the maximum number of tonal steps that can be discerned at all, that measure of dynamic range has very little relevance to real-world photography. What we care about as photographers is how much detail we can pull out of the shadows before image noise becomes too objectionable. This, of course, is a very subjective matter, and will vary with the application and even the subject matter in question. (Noise will be much more visible in subjects with large areas of flat tints and subtle shading than it would in subjects with strong, highly contrasting surface texture.)
What makes most sense then, is to specify useful dynamic range in terms of the point at which image noise reaches some agreed-upon threshold. To this end, Imatest computes a number of different dynamic range measurements, based on a variety of image noise thresholds. The noise thresholds are specified in terms of f-stops of equivalent luminance variation in the final image file, and dynamic range is computed for noise thresholds of 1.0 (low image quality), 0.5 (medium image quality), 0.25 (medium-high image quality) and 0.1 (high image quality). For most photographers and most applications, the noise thresholds of 0.5 and 0.25 f-stops are probably the most relevant to the production of acceptable-quality finished images, but many noise-sensitive shooters will insist on the 0.1 f-stop limit for their most critical work.
The image below shows the test results from Imatest for an in-camera JPEG file from the Sony A200 with a nominally-exposed density step target (Stouffer 4110), and the A200's contrast and DRO settings at their default positions.
These are very good numbers for a current-model DSLR, in the mid- to upper range of cameras we've tested. The tone curve also has a nice "S" shape to it, providing good gradation in both highlights and shadows. This can be seen when closely inspecting shots captured by the A200, where detail is held nicely in both strong highlights and deep shadows. Nice job!
Processing the A200's RAW (ARW) files through Adobe Camera Raw (ACR) version 4.3.1 improved dynamic range by more than a full stop. (It bears noting though, that extreme manipulation of RAW files to extend dynamic range can introduce severe color shifts in the resulting files: This dramatically increased dynamic range may only be really usable when converting the images to black and white. - As is the case with most cameras.) These results were obtained by using ACR's automatic settings; slightly better results may be possible by adjusting the sliders manually, but I found little improvement in my own twiddling. Worth noting here is that ACR's default noise reduction settings reduced the red- and blue- channel noise (see the plot in the lower left-hand corner) relative to the levels in the in-camera JPEG. ACR also shifted even more of the noise energy into high spatial frequencies, making its residual noise even less objectionable than that found in the camera JPEGs.
Dynamic Range, the bottom line:
The net result was that the A200 exhibited excellent dynamic range, its in-camera JPEGs perhaps helped a little by the A200's default "Standard DRO" (Dynamic Range Optimizer) setting. It should be noted though, that the DRO feature does nothing to increase the fundamental dynamic range of the camera: That's purely a factor of the sensor and associated electronics. What DRO does is optimize use of the available dynamic range, pulling some of the extreme tonal values into the visible range. We saw about 0.2 EV better DR with DRO set to Standard than with it either off or set to Advanced DRO+, but that's more likely a quirk of noise levels and differences in noise processing between the various settings than it is an indication of any change in real (vs perceived) dynamic range.
To get some perspective, here's a summary of the Sony A200's dynamic range performance, and how it compares to other digital SLRs that we also have Imatest dynamic range data for. (Results are arranged in order of decreasing dynamic range at the "High" quality level.):
| Dynamic Range (in f-stops) vs Image Quality (At camera's minimum ISO) |
||||
| Model | 1.0 (Low) |
0.5 (Medium) |
0.25 (Med-High) |
0.1 (High) |
| Fujifilm S3 Pro (Adobe Camera Raw 2) |
12.1 | 11.7 | 10.7 | 9.0 |
| Nikon D40x (Adobe Camera Raw 4.1) |
12.0 | 10.9 | 10.3 | 8.9 |
| Nikon D300 (Adobe Camera Raw 4.3.1) |
11.4 | 10.9 | 9.87 | 8.45 |
| Sony A200 (Adobe Camera Raw 4.3.1) |
11.6 | 10.4 | 9.82 | 8.43 |
| Nikon D40 (Adobe Camera Raw 4.1) |
11.9 | 10.9 | 9.89 | 8.3 |
| Pentax K-100D (Adobe Camera Raw 3.6) |
11.3 | 10.3 | 9.51 | 8.23 |
| Pentax K10D (Adobe Camera Raw 3.7) |
10.6 | 10.0 | 9.29 | 8.19 |
| Sony A100 (Adobe Camera Raw 3.4) |
11.3 | 10.5 | 9.69 | 8.16 |
| Canon EOS-1Ds Mark II (Adobe Camera Raw 3) |
11.2 | 10.3 | 9.4 | 8.14 |
| Nikon D40x (Camera JPEG) |
10.8 | 10.0 | 9.42 | 8.04 |
| Fujifilm S3 Pro (Camera JPEG) |
-- | 9.9 | 9.4 | 7.94 |
| Canon Digital Rebel XTi (Adobe Camera Raw 3.6) |
10.8 | 9.88 | 9.18 | 7.84 |
| Canon EOS-5D (Adobe Camera Raw 3) |
11.0 | 10.4 | 9.21 | 7.83 |
| Canon EOS-40D (Adobe Camera Raw 4.2) |
11.2 | 10.1 | 9.26 | 7.72 |
| Canon EOS-5D (Camera JPEG) |
10.2 | 9.68 | 8.82 | 7.65 |
| Nikon D200 (Adobe Camera Raw 3) |
10.6 | 9.65 | 8.96 | 7.61 |
| Nikon D80 (Adobe Camera Raw 3.6) |
11.1 | 10.4 | 9.42 | 7.51 |
| Olympus E510 (Adobe Camera Raw 4.1) |
10.0 | 9.43 | 8.64 | 7.46 |
| Nikon D300 (Camera JPEG) |
-- | -- | 8.70 | 7.44 |
| Pentax K10D | -- | 9.49 | 8.88 | 7.44 |
| Canon EOS-40D (Camera JPEG) |
10.6 | 9.52 | 8.78 | 7.42 |
| Nikon D50 (Camera JPEG) |
10.7 | 9.93 | 8.70 | 7.36 |
| Sony A200 (Camera JPEG) |
10.4 | 9.43 | 8.91 | 7.29 |
| Canon EOS 20D (Camera JPEG) |
10.3 | 9.66 | 8.85 | 7.29 |
| Nikon D40 (Camera JPEG) |
10.4 | 9.8 | 8.89 | 7.28 |
| Nikon D80 (Camera JPEG) |
10.1 | 9.43 | 8.48 | 7.12 |
| Canon Digital Rebel XT (Camera JPEG) |
10.3 | 9.51 | 8.61 | 7.11 |
| Nikon D200 (Camera JPEG) |
-- | 9.07 | 8.36 | 7.11 |
| Olympus EVOLT (Camera JPEG) |
10.8 | 9.26 | 8.48 | 7.07 |
| Olympus E410 (Adobe Camera Raw 4.1) |
10.2 | 9.4 | 8.24 | 7.05 |
| Canon Digital Rebel XTi (Camera JPEG) |
9.83 | 9.10 | 8.27 | 7.04 |
| Canon EOS-1Ds Mark II (Camera JPEG) |
10.3 | 9.38 | 8.6 | 7.04 |
| Canon Digital Rebel (Camera JPEG) |
10.1 | 9.11 | 8.47 | 6.97 |
| Panasonic DMC-L10 (Adobe Camera Raw 4.2) |
10.4 | 9.34 | 8.48 | 6.91 |
| Pentax *istDs (Camera JPEG) |
10.2 | 10 | 8.87 | 6.9 |
| Sony 100 (Camera JPEG) |
10.2 | 9.24 | 8.39 | 6.89 |
| Pentax K-100D (Camera JPEG) |
10.3 | 9.3 | 8.39 | 6.73 |
| Nikon D2x (Camera JPEG) |
-- | 8.93 | 7.75 | 6.43 |
| Panasonic DMC-L10 | -- | 8.94 | 8.00 | 6.38 |
| Olympus E410 (Camera JPEG) |
-- | -- | 7.60 | 5.99 |
| Nikon D70s (Camera JPEG) |
9.84 | 8.69 | 7.46 | 5.85 |
| Nikon D70 (Camera JPEG) |
9.81 | 8.76 | 7.58 | 5.84 |
| Olympus E510 (Camera JPEG) |
7.70 | 7.16 | 5.87 | 3.55 |
The results shown in the table are interesting. One of the first things that struck me when I initially looked at test data for a wide range of d-SLRs, was that here again, purely analytical measurements don't necessarily correlate all that well with actual photographic experience. There's no question that the Fuji S3 Pro deserves its place atop the list, as its unique "SR" technology does indeed deliver a very obvious improvement in tonal range in the highlight portion of the tonal scale. I was surprised to see the analytical results place the Olympus EVOLT as highly as they did, given that our sense of that camera's images was that they were in fact noisier than those of many other d-SLRs that we looked at. In the other direction, I was quite surprised to see the Nikon D2x place as low on the listings as it did, given that we found that camera's shadow detail to be little short of amazing.
One thing that's going on here though, is that we tested each camera at its lowest ISO setting, which should produce best-case noise levels. This is in fact what many photographers will be most interested in, but it does perhaps place some of the Nikons (like the D40) at a disadvantage, as their lowest ISO setting is 200, as compared to the ISO 100 settings available on most other models.
Sony A200 Resolution Chart Test Results
The chart above shows consolidated results from spatial frequency response measurements in both the horizontal and vertical axes. The "MTF 50" numbers tend to correlate best with visual perceptions of sharpness, so those are what I focus on here. The uncorrected resolution figures are 1,837 line widths per picture height in the horizontal direction (corresponding to the vertically-oriented edge), and 1,747 lines along the vertical axis (corresponding to the horizontally-oriented edge), for a combined average of 1,792 LW/PH. Correcting to a "standardized" sharpening with a one-pixel radius increased both vertical and horizontal resolution slightly, resulting in an average of 1,929 LW/PH. This is a about average performance for a 10-megapixel camera.
To see what's going on, refer to the plots below, which show the actual edge profiles for both horizontal and vertical edges, in both their original and corrected forms. Here, you can see that the default in-camera sharpening applied is pretty close to ideal, but can still benefit from a bit of unsharp masking. (One thing we're happy to see is that the Sony A200 doesn't oversharpen its images too much, so it doesn't obscure fine detail as much as some cameras do.)
 Fujifilm GFX 50S Review
 Fujifilm X-T3 Review
 Olympus E-M5 III Review

Follow Imaging Resource