Nikon D3 Imatest Results
We routinely use Norman Koren's excellent "Imatest" analysis program for quantitative, thoroughly objective analysis of digicam test images. I highly recommend it to our technically-oriented readers, as it's far and away the best, most comprehensive analysis program I've found to date.
My comments below are just brief observations of what we see in the Imatest results. A full discussion of all the data Imatest produces is really beyond the scope of this review: Visit the Imatest web site for a full discussion of what the program measures, how it performs its computations, and how to interpret its output.
Here's some of the results produced by Imatest for the Nikon D3:
sRGB Accuracy Comparison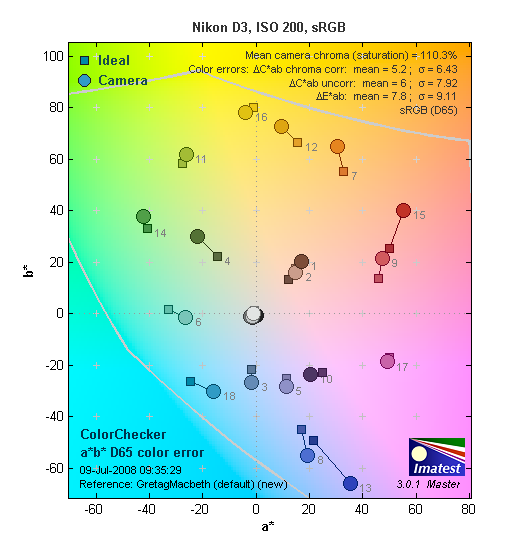 |
||||
The Nikon D3 showed good color accuracy, though with saturation levels a little higher than we're accustomed to finding in professional SLRs. Hue accuracy was quite good, with most of the hue shift occurring in the cyans, sky blues, reds and oranges. Average saturation was 110.3% (oversaturated by 10.3%, mostly in the blues, reds and greens). Average "delta-C" color error was only 5.2 after correction for saturation, which is quite low, albeit very slightly higher than most of the competition. All in all, a very good color response for an SLR. Mouse over the links below the illustration above to compare results with competing models.
Adobe RGB Accuracy Comparison |
||||
Using the Adobe RGB color space (which provides a much wider gamut, or range of colors that can be expressed), the Nikon D3 delivers more highly saturated color, with an average saturation of 115.8% and average saturation-corrected hue error of 5.52 "delta-C" units, which in this case is a smidgen more accurate than most of the competition. Again, mouse over the links below the illustration above to compare results with competing models.
Color Analysis

This image shows how the Nikon D3 actually rendered the colors of the MacBeth chart, compared to a numerically ideal treatment. In each color swatch, the outer perimeter shows the color as actually captured by the camera, the inner square shows the numerically ideal color, after correcting for the luminance of the photographed chart (as determined by a second-order curve fit to the values of the gray swatches), and the small rectangle inside the inner square shows the numerically ideal color, without any luminance correction. This image shows the D3's excellent hue accuracy, as well as a gamma curve that results in an overexposure of some colors, notably blues, reds, and some greens. (We've seen this in most cameras, increasing the "punch" of images by lightening bright colors a little, while actually keeping both the hue and saturation level very close to technically accurate values.)
Noise Analysis

There's a lot in this particular graph, a lot more than we have room to go into here. (This set of plots has also changed a little in the more recent versions of Imatest. Some of the plots that were shown here previously are now shown in other Imatest output. Since we largely focus on the Noise Spectrum plot, we'll only show the graphic above, which includes that plot.)
In comparing these graphs with those from competing cameras, I've found that the Noise Spectrum graph at lower right is the most important. Cameras that manage to shift their noise spectrum to higher frequencies have much finer-grained noise structures, making their noise less visually objectionable. In the graph above, this would show up as a noise spectrum curve that remained higher on the right side, representing higher noise frequencies. The champion at this was (and still is) the Canon EOS-1Ds Mark II, which produced remarkably fine-grained image noise, even at very high ISOs.
Here, we can see why ISO 100 is treated as a "LO" extension of the normal ISO range for the D3, as noise is a bit higher than ISO 200, particularly in the blue channel. Below is the plot for ISO 200, the D3's normal base sensitivity.

The D3's noise performance at ISO 200 doesn't quite rise to the level of the 1Ds Mark II, but it nonetheless does a good job of keeping plenty of the noise energy at high frequencies, at least in the blue channel and in the luminance values. The red and green channels oddly show a lot of low-frequency energy, which would translate into blotchiness in the final images. The good news though, is that overall noise levels at ISO 200 are quite low, so the blotchiness isn't visible without considerable tone-curve tweaking. Bottom line, the Nikon D3 noise levels are low at low ISO, with a frequency spectrum that has more energy on the higher frequency (right-hand) side of the curve than do most cameras in the blue and luminance signals, but less so in red and green.

Here's the same set of noise data at ISO 3,200. Here, the Noise Spectrum graph is shifted a bit more toward the left-hand, lower-frequency side than it was at ISO 200, coarsening the "grain" of the image noise patterns somewhat, but the spike in the color channels has been reduced somewhat. (And it's now the blue and red channels that are blotchy, with green behaving itself better. Odd/interesting...) Once again, very good performance.

Here's the same set of noise data at ISO 6,400. A surprisingly flat curve, indicating noise is well controlled and fine grained even at this high ISO, but again with more low-frequency energy present in the red and blue channels.

Here's the same set of noise data at ISO 12,800. It a little hard to tell because of the change in scale, but there is a dramatic shift towards the left, lower-frequency region.

The trend of increasing the coarsening the "grain" of the image noise patterns continues at ISO 25,600.

This chart compares the Nikon D3's noise performance over a range of ISOs against that of other cameras, using default settings. While we continue to show noise plots of this sort because readers ask for them, we each time point out that the noise magnitude is only a small part of the story, the grain pattern being much more important. In the case of the Nikon D3, the magnitude of the image noise starts out slightly below most of the competition at ISO 100, and remains lower for all ISOs in common, other than 1,600, where it's just slightly above that of the Canon EOS 1D Mark III. A really excellent performance, and a major benefit of Nikon not succumbing to the temptation of cramming more pixels into the full-frame sensor of the D3. Keep in mind these are at default settings, so the shape and positions of the curves will be influenced by your settings.

Here's a plot comparing results using the D3's four High ISO noise reduction settings. Note that Hi ISO NR does not apply under ISO 2,000, so the graph starts at ISO 1,600, where the results of the different settings are the same. Also note that above ISO 6400, the "Off" setting still applies "minimal" noise reduction, explaining why the "Off" and "Low" curves are so close to each other at the highest ISOs. The bump in the "Low" curve at ISO 12,800 is doubtless because of the very slight difference in exposure levels between the Off and Low cases. Imatest reported an underexposure of 0.14 EV for the Low NR shot, but an underexposure of only 0.06 EV for the NR Off image. It seems that tiny shift in exposure was enough to boost one curve above the other. (Ditto for the Low and Normal curves at ISO 3,200.)
Nikon D3 Dynamic Range Analysis
A key parameter in a digital camera is its Dynamic Range, the range of brightness that can be faithfully recorded. At the upper end of the tonal scale, dynamic range is dictated by the point at which the RGB data "saturates" at values of 255, 255, 255. At the lower end of the tonal scale, dynamic range is determined by the point at which there ceases to be any useful difference between adjacent tonal steps. Note the use of the qualifier "useful" in there: While it's tempting to evaluate dynamic range as the maximum number of tonal steps that can be discerned at all, that measure of dynamic range has very little relevance to real-world photography. What we care about as photographers is how much detail we can pull out of the shadows before image noise becomes too objectionable. This, of course, is a very subjective matter, and will vary with the application and even the subject matter in question. (Noise will be much more visible in subjects with large areas of flat tints and subtle shading than it would in subjects with strong, highly contrasting surface texture.)
What makes most sense then, is to specify useful dynamic range in terms of the point at which image noise reaches some agreed-upon threshold. To this end, Imatest computes a number of different dynamic range measurements, based on a variety of image noise thresholds. The noise thresholds are specified in terms of f-stops of equivalent luminance variation in the final image file, and dynamic range is computed for noise thresholds of 1.0 (low image quality), 0.5 (medium image quality), 0.25 (medium-high image quality) and 0.1 (high image quality). For most photographers and most applications, the noise thresholds of 0.5 and 0.25 f-stops are probably the most relevant to the production of acceptable-quality finished images, but many noise-sensitive shooters will insist on the 0.1 f-stop limit for their most critical work.
The image below shows the test results from Imatest for an in-camera JPEG file from the Nikon D3 with a nominally-exposed density step target (Stouffer 4110), and the D3's Active D-Lighting and contrast settings at their default positions.

These are excellent results for in-camera JPEGs, near the top of the SLRs we've tested. The tone curve shows excellent gradation in highlights, but the shadow end trails off more abruptly. A sharp tail-off at the shadow end usually signals plugged shadows and lost detail in images, but the D3 showed no such behavior. There's clearly more gradation at the highlight end of the tonal scale, but examining deep shadows on the D3's test images showed excellent detail, in all but the very darkest shadows. - In the darkest shadows though, there was indeed some plugging, rather than a smooth trailing-off. (We're not sure why Imatest sometimes doesn't report DR for the lower quality thresholds like this. We've called it to the attention of the program's author; will try to come back and re-do these graphs if/when he develops a fix.)

Processing the D3's RAW (NEF) files through Adobe Camera Raw (ACR) version 4.5 beta improved dynamic range by over 3/4 stop at the best quality level, and by more than 3 stops total. ACR's automatic settings were used, then manually tweaked for slightly better results. Worth noting here is that ACR's default noise reduction settings reduced the average noise relative to the levels in the in-camera JPEG. ACR also shifted slightly more of the noise energy into lower spatial frequencies.
Active D-Lighting. The charts below show the effect of the Nikon D3's three Active D-Lighting settings: Low, Normal and High.


These plots show that most of the D3's Active D-Lighting impact occurs at the highlight end of the tone curve, at least when confronted with an artificial image like the greyscale step-wedge used for our dynamic range measurements. What's a little hard to see with the plots arranged vertically like this though, is that the shadow end of the curve is lifted somewhat as well: Imatest adjusts the vertical axis to show the most detail in the curves, but the result is that the vertical scale can change somewhat between plots. Looking closely, you'll see that the bottom end of the Density Response curve is a fair bit higher on the "High" plot than on the "Low" one. The major impact though, is the way Active D-Lighting flattens-off the very top of the tone curve. This translates into excellent preservation of detail in strong highlights, something the D3 does a better job at than most cameras we've tested.
One thing you soon learn when playing with tone curves though: There's no free lunch. Ultimately, there's only so much dynamic range to work with, you just get to choose whether you "spend" it on the highlights or shadows. Because Active D-Lighting (with the step-chart image, at least) is choosing to pay a lot of attention to the highlights, it should come as no surprise that the deepest shadows suffer as a result. In fact, because the camera is compressing the tone curve the way it is, the noise levels in the shadows limit the calculated dynamic range a fair bit, relative to the camera's performance using its default settings. Still, for images with very strong highlight detail, Dynamic D-Lighting really works very well. Equally important, the resulting images look very natural, not appearing as though they'd had their tone curves massaged to any great extent.
Dynamic Range, the bottom line:
The net result was that the D3 came in ahead most other DSLR models we've tested, bested only by the Canon 1Ds Mark III, Nikon D40x, Canon Rebel XSi (which has it's Advanced Lighting Option enabled by default) and Canon EOS-1D Mark III in its JPEG file performance. (These cameras are shown in dark yellow highlight in the table below.) When it comes to images processed from RAW files, only the S3 Pro, D40x and 1Ds Mark II beat it, and even then, by a quarter-stop or less.
To get some perspective, here's a summary of the Nikon D3's dynamic range performance, and how it compares to other digital SLRs that we also have Imatest dynamic range data for. (Results are arranged in order of decreasing dynamic range at the "High" quality level.):
| Dynamic Range (in f-stops) vs Image Quality (At camera's base ISO) |
||||
| Model | 1.0 (Low) |
0.5 (Medium) |
0.25 (Med-High) |
0.1 (High) |
| Fujifilm S3 Pro (Adobe Camera Raw 2) |
12.1 | 11.7 | 10.7 | 9.0 |
| Nikon D40x (Adobe Camera Raw 4.1) |
12.0 | 10.9 | 10.3 | 8.9 |
| Canon EOS-1Ds Mark III (Adobe Camera Raw 4.5) |
11.5 | 10.7 | 9.96 | 8.84 |
| Nikon D3 (Adobe Camera Raw 4.5) |
11.7 | 11.0 | 10.0 | 8.75 |
| Canon EOS-1D Mark III (Adobe Camera Raw 4.5) |
11.7 | 10.7 | 9.99 | 8.73 |
| Nikon D300 (Adobe Camera Raw 4.3.1) |
11.4 | 10.9 | 9.87 | 8.45 |
| Sony A200 (Adobe Camera Raw 4.3.1) |
11.6 | 10.4 | 9.82 | 8.43 |
| Nikon D60 (Adobe Camera Raw 4.4.1) |
11.6 | 10.5 | 9.74 | 8.31 |
| Nikon D40 (Adobe Camera Raw 4.1) |
11.9 | 10.9 | 9.89 | 8.3 |
| Canon EOS-1Ds Mark III (Camera JPEG) |
10.9 | 10.2 | 9.71 | 8.23 |
| Pentax K100D (Adobe Camera Raw 3.6) |
11.3 | 10.3 | 9.51 | 8.23 |
| Pentax K200D (Adobe Camera Raw 4.4.1) |
-- | 10.5 | 9.54 | 8.19 |
| Pentax K10D (Adobe Camera Raw 3.7) |
10.6 | 10.0 | 9.29 | 8.19 |
| Sony A100 (Adobe Camera Raw 3.4) |
11.3 | 10.5 | 9.69 | 8.16 |
| Canon EOS-1Ds Mark II (Adobe Camera Raw 3) |
11.2 | 10.3 | 9.4 | 8.14 |
| Nikon D40x (Camera JPEG) |
10.8 | 10.0 | 9.42 | 8.04 |
| Canon Rebel XSi (Camera JPEG) (ALO on by default) |
11.3 | 10.1 | 9.34 | 8.01 |
| Fujifilm S3 Pro (Camera JPEG) |
-- | 9.9 | 9.4 | 7.94 |
| Sony A350 (Adobe Camera Raw 4.4) |
11.6 | 10.5 | 9.61 | 7.89 |
| Canon EOS-1D Mark III (Camera JPEG) |
-- | 10.2 | 9.7 | 7.88 |
| Nikon D3 (Camera JPEG) |
-- | -- | -- | 7.87 |
| Canon Digital Rebel XTi (Adobe Camera Raw 3.6) |
10.8 | 9.88 | 9.18 | 7.84 |
| Canon EOS-5D (Adobe Camera Raw 3) |
11.0 | 10.4 | 9.21 | 7.83 |
| Canon EOS-40D (Adobe Camera Raw 4.2) |
11.2 | 10.1 | 9.26 | 7.72 |
| Canon Rebel XSi (Adobe Camera Raw 4.4.1) |
10.6 | 9.95 | 9.1 | 7.68 |
| Canon EOS-5D (Camera JPEG) |
10.2 | 9.68 | 8.82 | 7.65 |
| Olympus E-3 (Adobe Camera Raw 4.3) |
10.3 | 10.1 | 9.29 | 7.64 |
| Nikon D60 (Camera JPEG) |
10.5 | 9.62 | 8.89 | 7.62 |
| Nikon D200 (Adobe Camera Raw 3) |
10.6 | 9.65 | 8.96 | 7.61 |
| Nikon D80 (Adobe Camera Raw 3.6) |
11.1 | 10.4 | 9.42 | 7.51 |
| Olympus E-500 (Adobe Camera Raw 3) |
10.7 | 9.97 | 8.90 | 7.46 |
| Olympus E-510 (Adobe Camera Raw 4.1) |
10.0 | 9.43 | 8.64 | 7.46 |
| Pentax K10D (Camera JPEG) |
-- | 9.49 | 8.88 | 7.44 |
| Nikon D300 (Camera JPEG) |
-- | -- | 8.70 | 7.44 |
| Nikon D2Xs (Adobe Camera Raw 3.6) |
10.6 | 9.9 | 8.93 | 7.42 |
| Canon EOS-40D (Camera JPEG) |
10.6 | 9.52 | 8.78 | 7.42 |
| Nikon D50 (Camera JPEG) |
10.7 | 9.93 | 8.70 | 7.36 |
| Sony A200 (Camera JPEG) (DRO on by default) |
10.4 | 9.43 | 8.91 | 7.29 |
| Canon EOS 20D (Camera JPEG) |
10.3 | 9.66 | 8.85 | 7.29 |
| Canon EOS 30D (Camera JPEG) |
10.3 | 9.5 | 8.57 | 7.29 |
| Nikon D40 (Camera JPEG) |
10.4 | 9.8 | 8.89 | 7.28 |
| Sony A350 (Camera JPEG) (DRO on by default) |
10.3 | 9.55 | 8.85 | 7.19 |
| Nikon D80 (Camera JPEG) |
10.1 | 9.43 | 8.48 | 7.12 |
| Canon Digital Rebel XT (Camera JPEG) |
10.3 | 9.51 | 8.61 | 7.11 |
| Nikon D200 (Camera JPEG) |
-- | 9.07 | 8.36 | 7.11 |
| Olympus E-300 (Camera JPEG) |
10.8 | 9.26 | 8.48 | 7.07 |
| Olympus E-410 (Adobe Camera Raw 4.1) |
10.2 | 9.4 | 8.24 | 7.05 |
| Olympus E-500 (Camera JPEG) |
10 | 9.14 | 8.16 | 7.05 |
| Canon Digital Rebel XTi (Camera JPEG) |
9.83 | 9.10 | 8.27 | 7.04 |
| Canon EOS-1Ds Mark II (Camera JPEG) |
10.3 | 9.38 | 8.6 | 7.04 |
| Pentax K200D (Camera JPEG) |
-- | 9.5 | 8.3 | 7.01 |
| Canon Digital Rebel (Camera JPEG) |
10.1 | 9.11 | 8.47 | 6.97 |
| Nikon D2Xs (Camera JPEG) |
9.82 | 8.98 | 8.23 | 6.97 |
| Panasonic DMC-L10 (Adobe Camera Raw 4.2) |
10.4 | 9.34 | 8.48 | 6.91 |
| Sigma DP1 (Camera JPEG) |
-- | 8.95 | 8.13 | 6.91 |
| Pentax *istDs (Camera JPEG) |
10.2 | 10 | 8.87 | 6.9 |
| Sony A100 (Camera JPEG) |
10.2 | 9.24 | 8.39 | 6.89 |
| Pentax K100D (Camera JPEG) |
10.3 | 9.3 | 8.39 | 6.73 |
| Nikon D2x (Camera JPEG) |
-- | 8.93 | 7.75 | 6.43 |
| Olympus E-3 (Camera JPEG) |
9.32 | 9.06 | 8.5 | 6.42 |
| Panasonic DMC-L10 (Camera JPEG) |
-- | 8.94 | 8.00 | 6.38 |
| Olympus E-420 (Camera JPEG) |
9.18 | 8.82 | 7.93 | 6.37 |
| Olympus E-410 (Camera JPEG) |
-- | -- | 7.60 | 5.99 |
| Nikon D70s (Camera JPEG) |
9.84 | 8.69 | 7.46 | 5.85 |
| Nikon D70 (Camera JPEG) |
9.81 | 8.76 | 7.58 | 5.84 |
| Olympus E-510 (Camera JPEG) |
7.70 | 7.16 | 5.87 | 3.55 |
The results shown in the table are interesting. One of the first things that struck me when I initially looked at test data for a wide range of d-SLRs, was that here again, purely analytical measurements don't necessarily correlate all that well with actual photographic experience. There's no question that the Fuji S3 Pro deserves its place atop the list, as its unique "SR" technology does indeed deliver a very obvious improvement in tonal range in the highlight portion of the tonal scale. I was surprised to see the analytical results place the Olympus E-300 as highly as they did, given that our sense of that camera's images was that they were in fact noisier than those of many other d-SLRs that we looked at. In the other direction, I was quite surprised to see the Nikon D2x place as low on the listings as it did, given that we found that camera's shadow detail to be little short of amazing.
One thing that's going on here though, is that we tested each camera at its lowest (base) ISO setting, which should produce best-case noise levels. This is in fact what many photographers will be most interested in, but it does perhaps place some of the Nikons (like the D40) at a disadvantage, as their lowest ISO setting is 200, as compared to the ISO 100 settings available on most other models.
Nikon D3 Resolution Chart Test Results

The chart above shows consolidated results from spatial frequency response measurements in both the horizontal and vertical axes. The "MTF 50" numbers tend to correlate best with visual perceptions of sharpness, so those are what I focus on here. The uncorrected resolution figures are 1,422 line widths per picture height in the horizontal direction (corresponding to the vertically-oriented edge), and 1,330 lines along the vertical axis (corresponding to the horizontally-oriented edge), for a combined average of 1,376 LW/PH. Correcting to a "standardized" sharpening with a one-pixel radius increased both vertical and horizontal resolution rather significantly, resulting in an average of 2,421 LW/PH.
(Note: We normally shoot DSLR resolution tests with Sigma 70mm f/2.8 macro lenses, one of the sharpest lenses we've tested to date over on SLRgear.com. With the D3 though, the Sigma 70mm produced exposure errors, so we weren't confident just what aperture the images were actually being shot at. To avoid this uncertainty, we reverted to the Nikon 105mm f/2.8 macro (the original, not the newer VR model, which is softer), also an exceptionally sharp lens. At f/8, there should be little or no difference in the performance of the two lenses, so results here should compare very well with those shot on other cameras with the Sigma 70mm.)
To see what's going on, refer to the plots below, which show the actual edge profiles for both horizontal and vertical edges, in both their original and corrected forms. Here, you can see that there is very conservative in-camera sharpening applied (no noticeable bump at the top and bottom ends of the black edge profile curves). Imatest reports that the horizontal direction (vertical edge) is "undersharpened" by 23.6% while the vertical direction (horizontal edge) is undersharpened by 26.7%. Professionals and serious amateurs prefer this to oversharpening, and the D3's images respond very well to the use of strong/tight sharpening post-exposure in Photoshop or some other image editor. (That said, you can still extract more fine detail if you begin with a RAW file, rather than a JPEG.)
.


 Fujifilm GFX 50S Review
 Fujifilm X-T3 Review
 Olympus E-M5 III Review

Follow Imaging Resource